Cloud Native London 2018
Monitoring Kubernetes: Follow the Data
· London, UK
At Datadog they help thousands of organizations monitor their infrastructure and applications. In this session, Daniel will dive deeper into the several hundred trillion data points they’ve gathered to extract information about the real-world use of Kubernetes and see trends in container and orchestrator usage. As you look at Kubernetes and container usage data, you will also learn about the top applications being used in orchestrated environments and, using the data, provide insight into which metrics you should watch and how to troubleshoot based on those metrics. In this session, Daniel will explore a framework for your metrics and how to use it to find solutions to the issues that come up. You will also learn the three types of monitoring data; what to collect; what should trigger an alert (avoiding an alert storm and pager fatigue); and how to follow the resources to find the root causes of problems. Although the real-world Kubernetes and container use data is derived from Datadog users, the focus of this session is not tool specific, so you will leave with strategies and frameworks that you can implement in your container-based environments today regardless of the platforms and tools you use.
MONITORING K8S: FOLLOW THE DATA DANIEL MAHER, DATADOG @phrawzty
TRENDS IN CONTAINERISATION 2. THE QUALITIES OF GOOD METRICS 3. SCALING KUBERNETES (W/ METRICS)
DANIEL MAHER D O C S & TA L K S D E V O P S D AY S G R E AT O U T D O O R S GOURMAND SUITS FOR NO REASON @phrawzty
D ATA D O G SAAS-BASED MONITORING T R I L L I O N S O F P O I N T S / D AY WE’RE HIRING: w w w. d a t a d o g h q . c o m / c a r e e r s @datadoghq
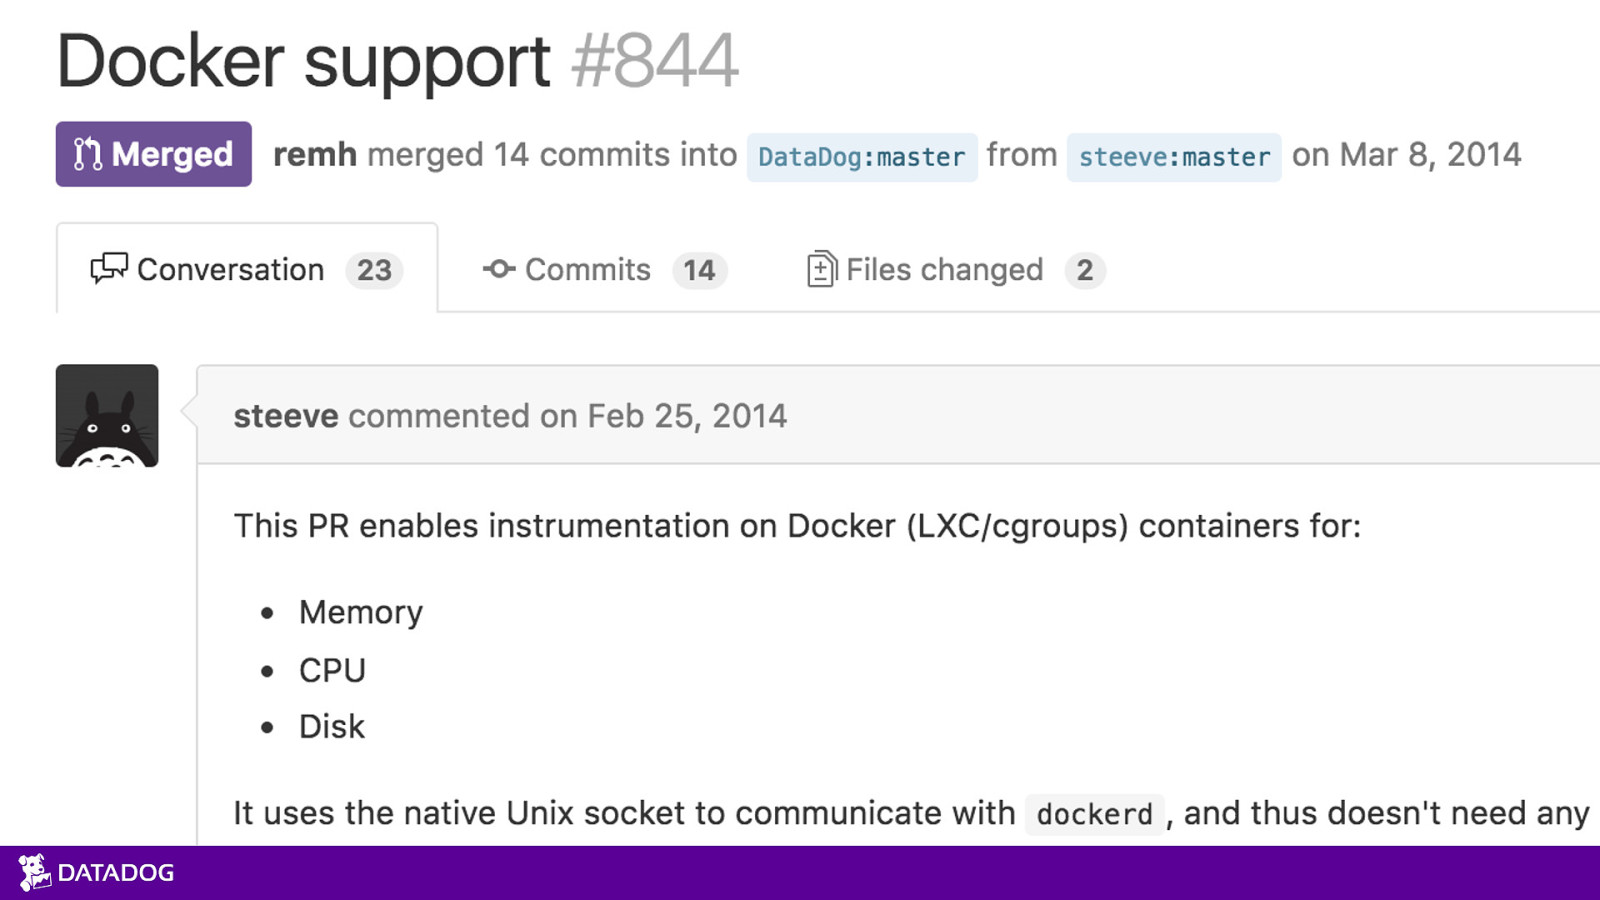
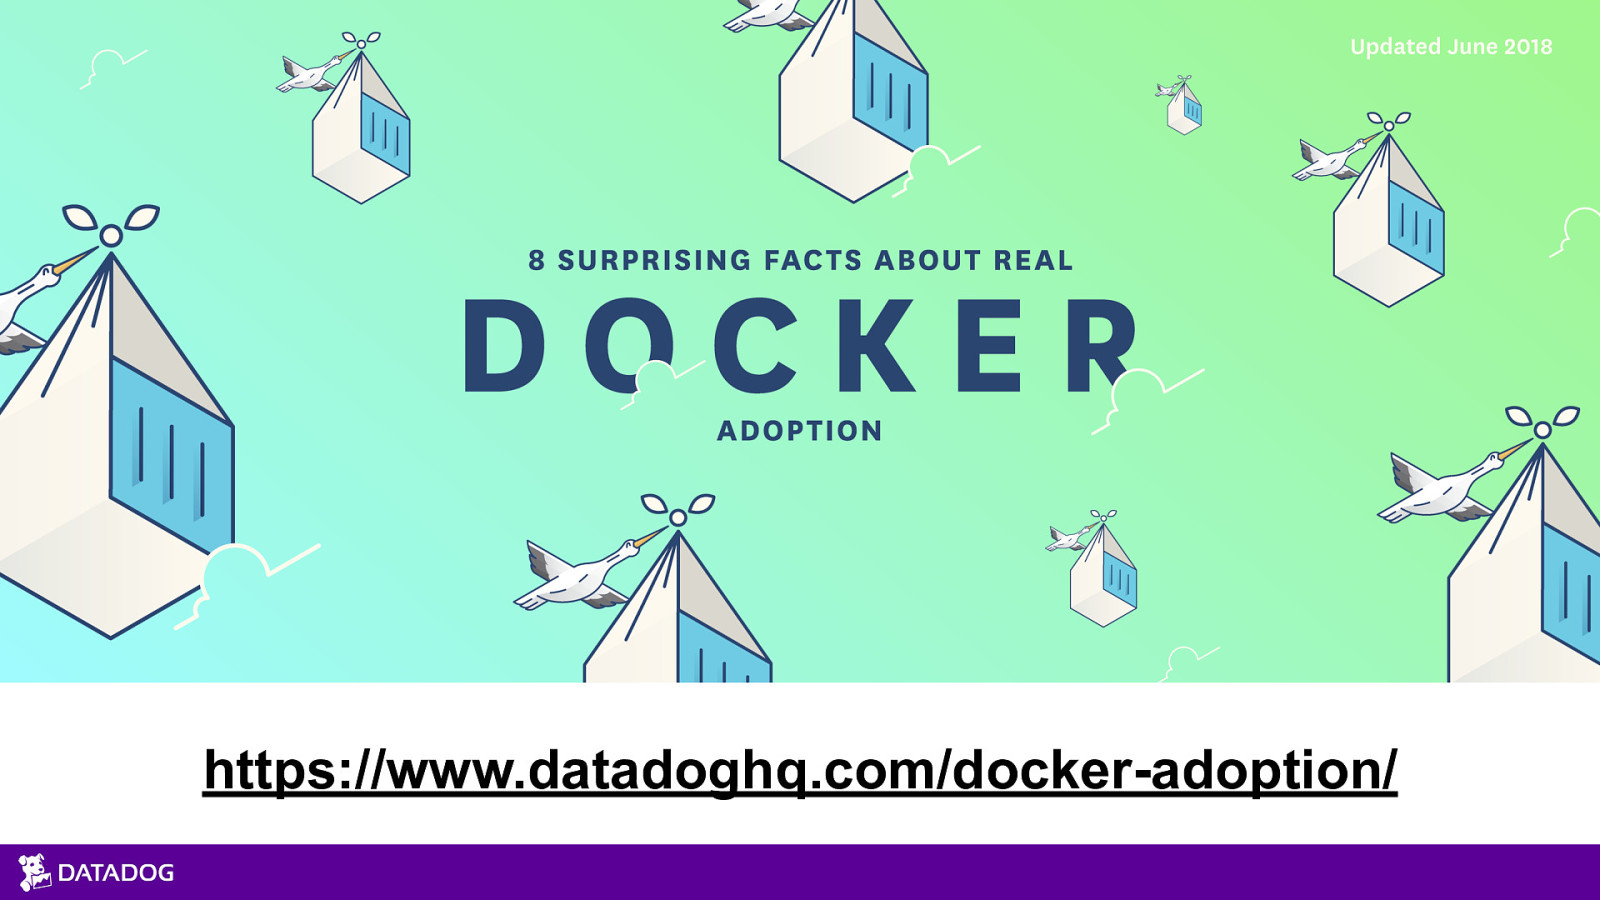
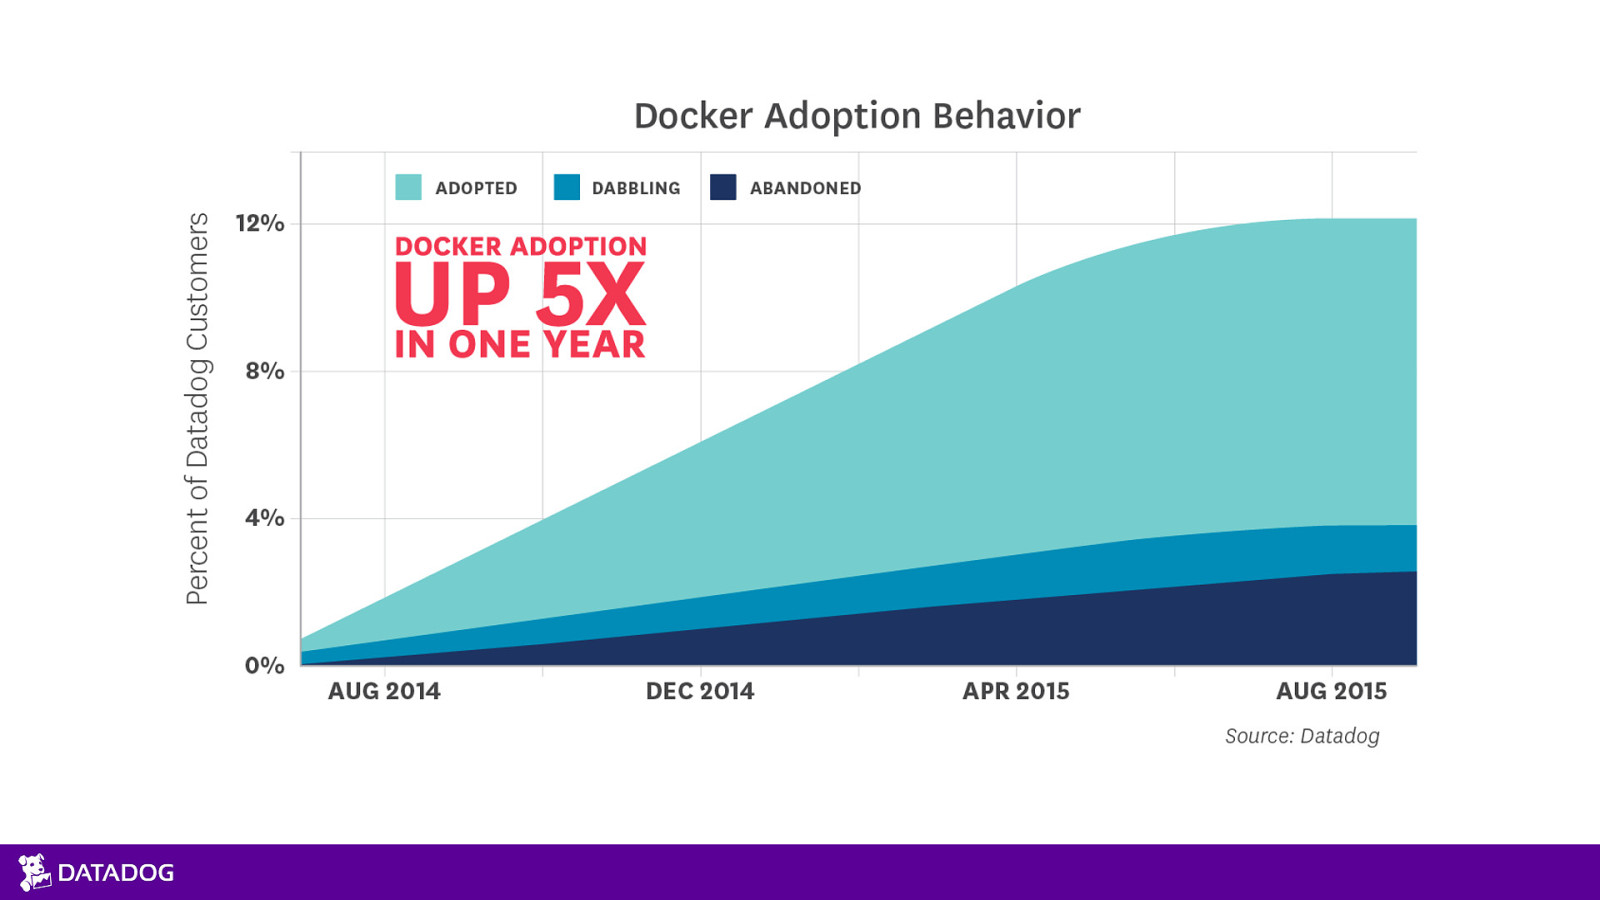
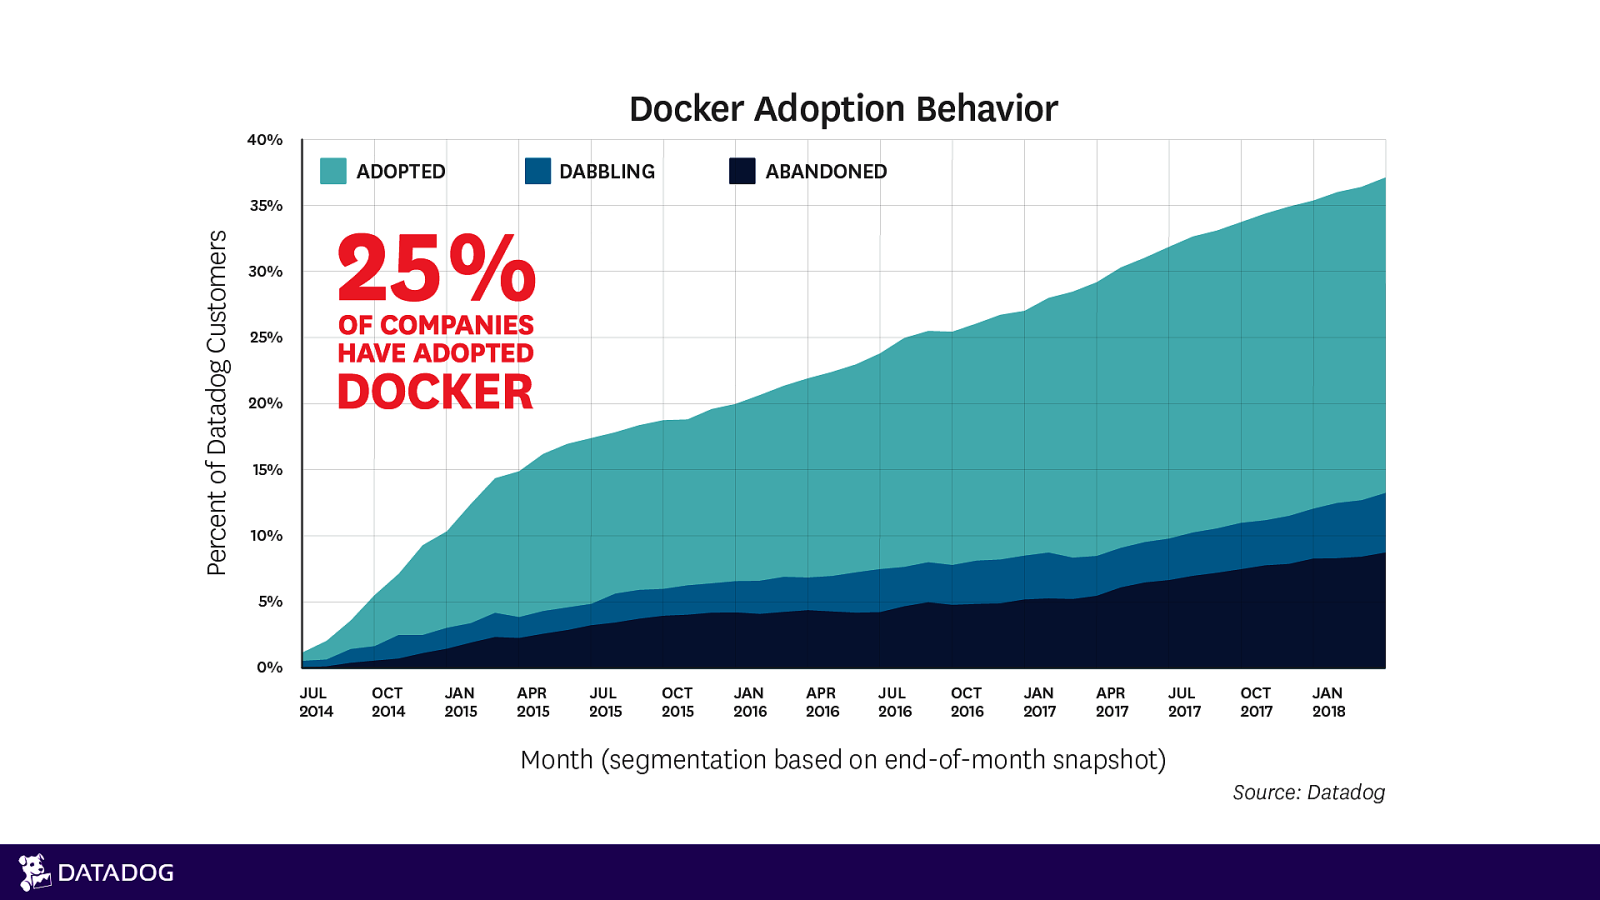
https://www.datadoghq.com/docker-adoption/
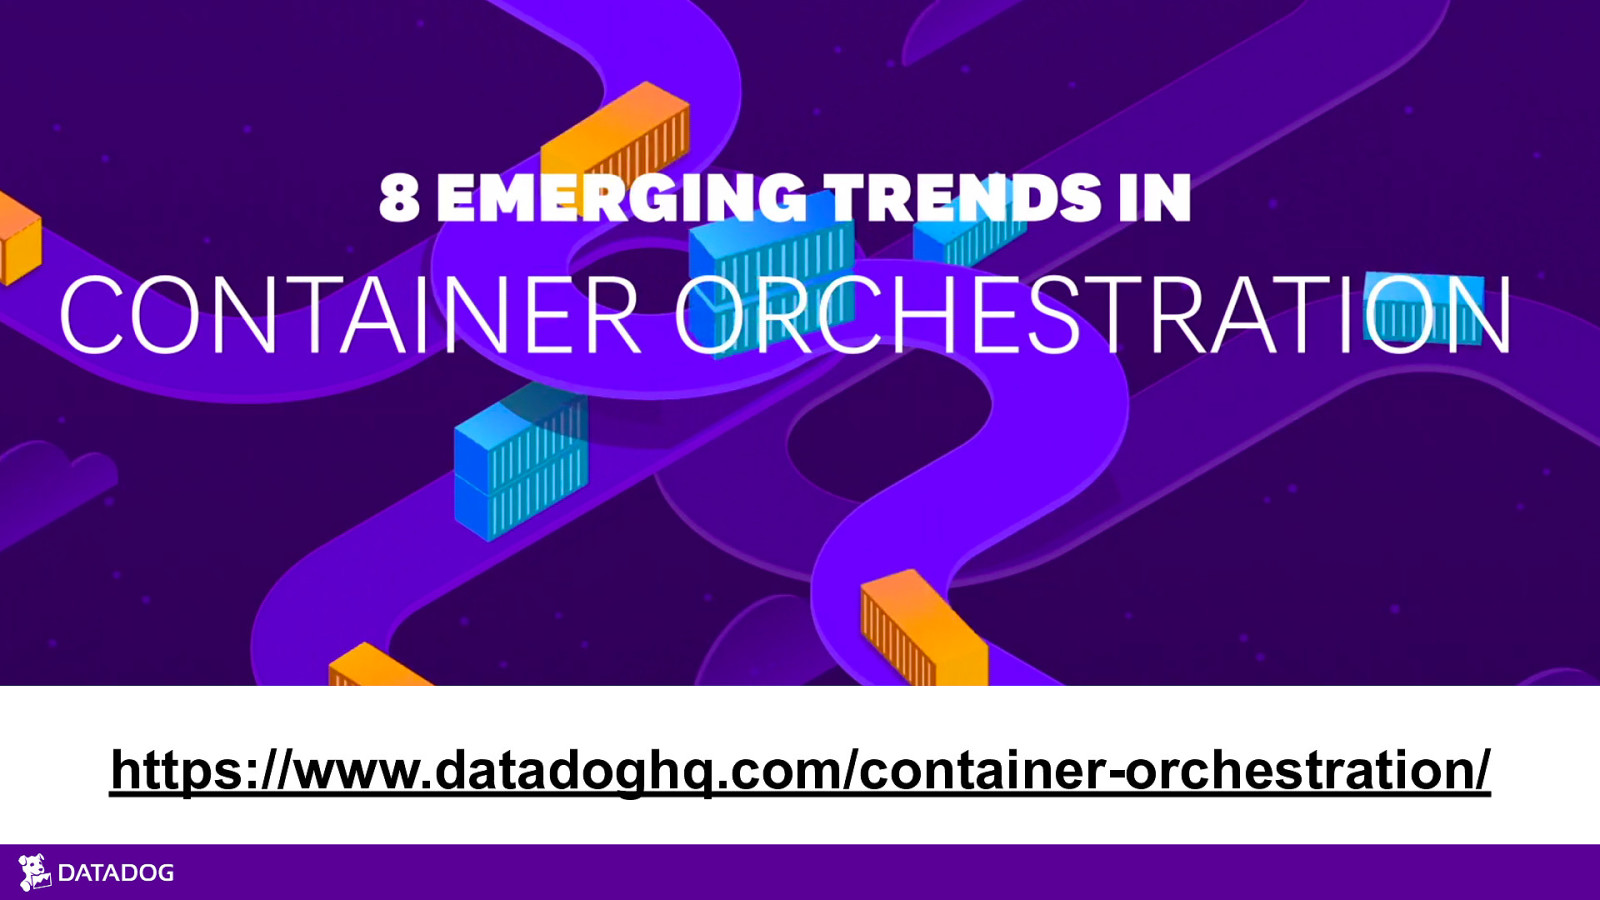
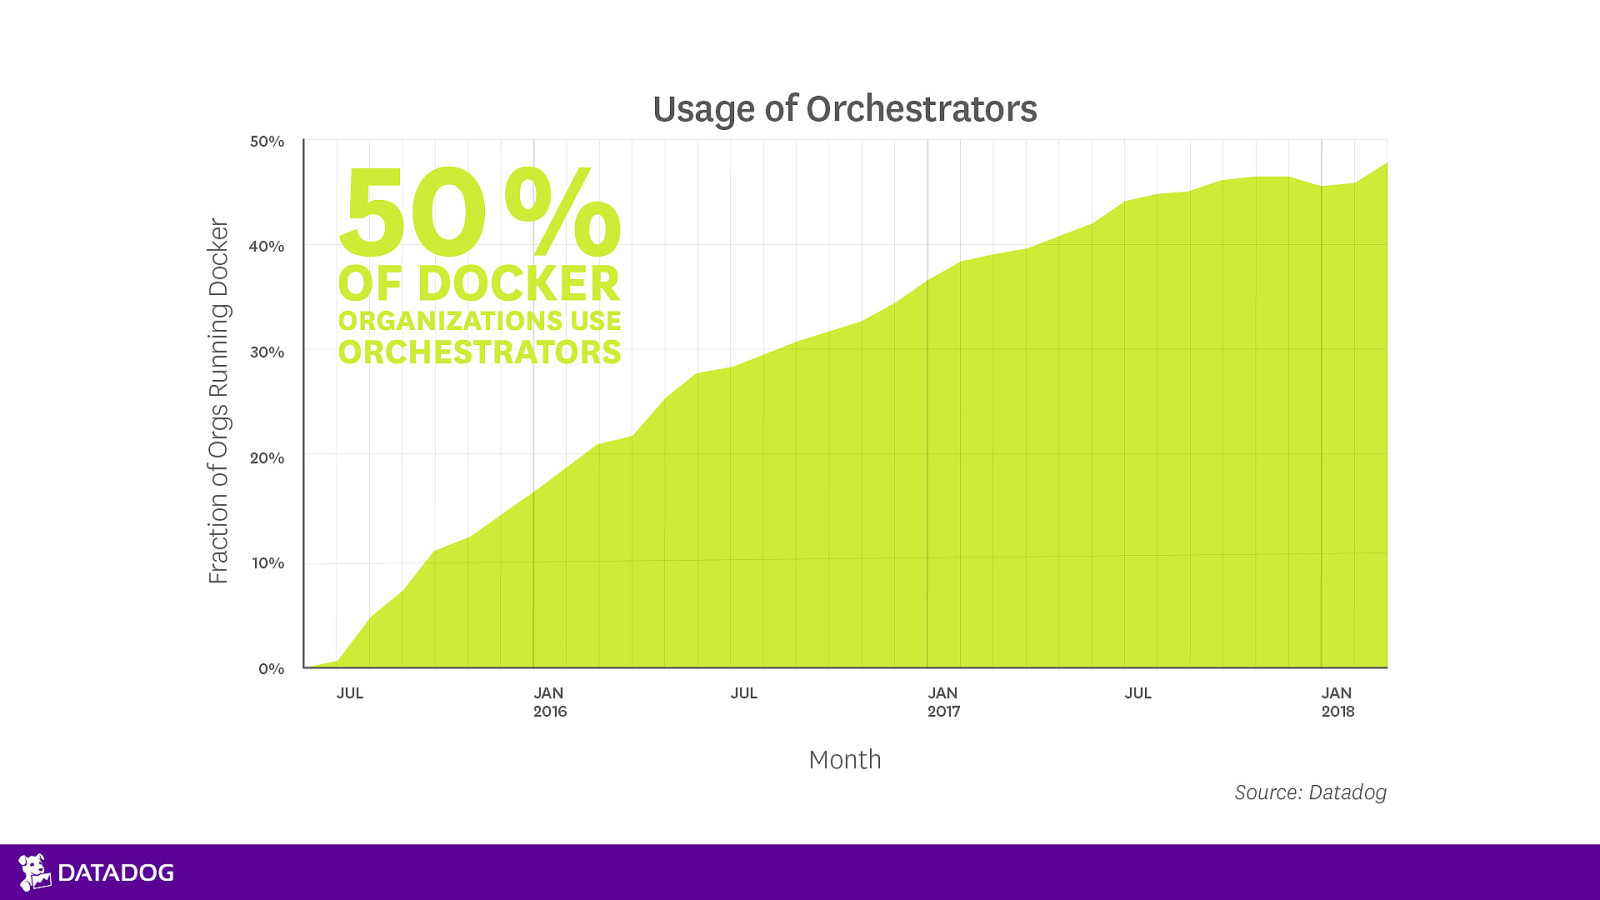
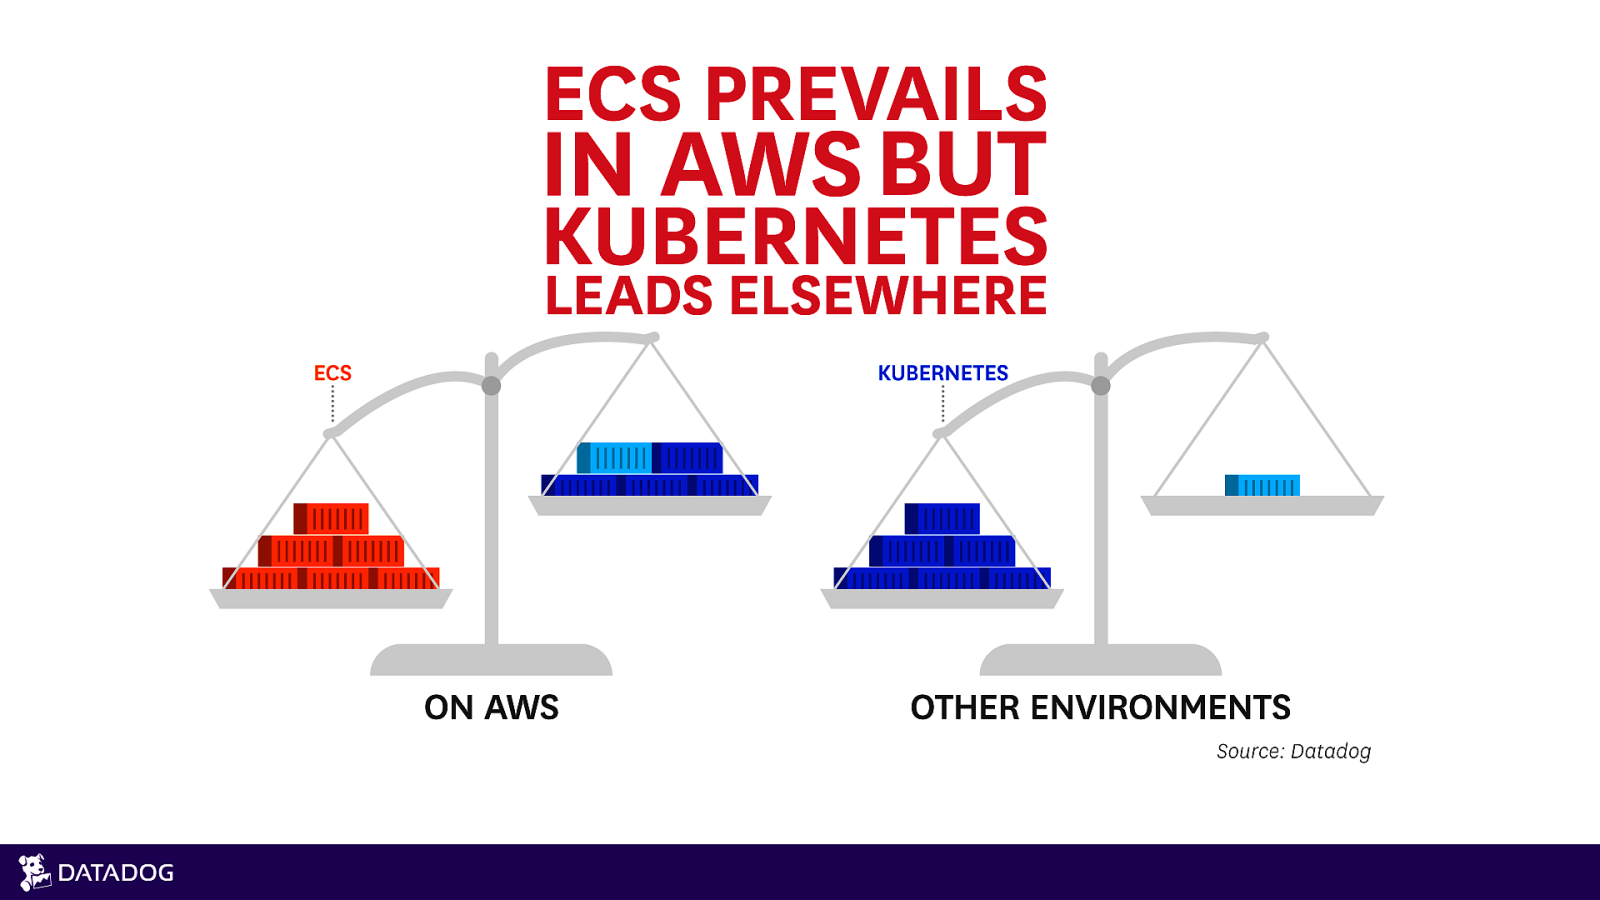
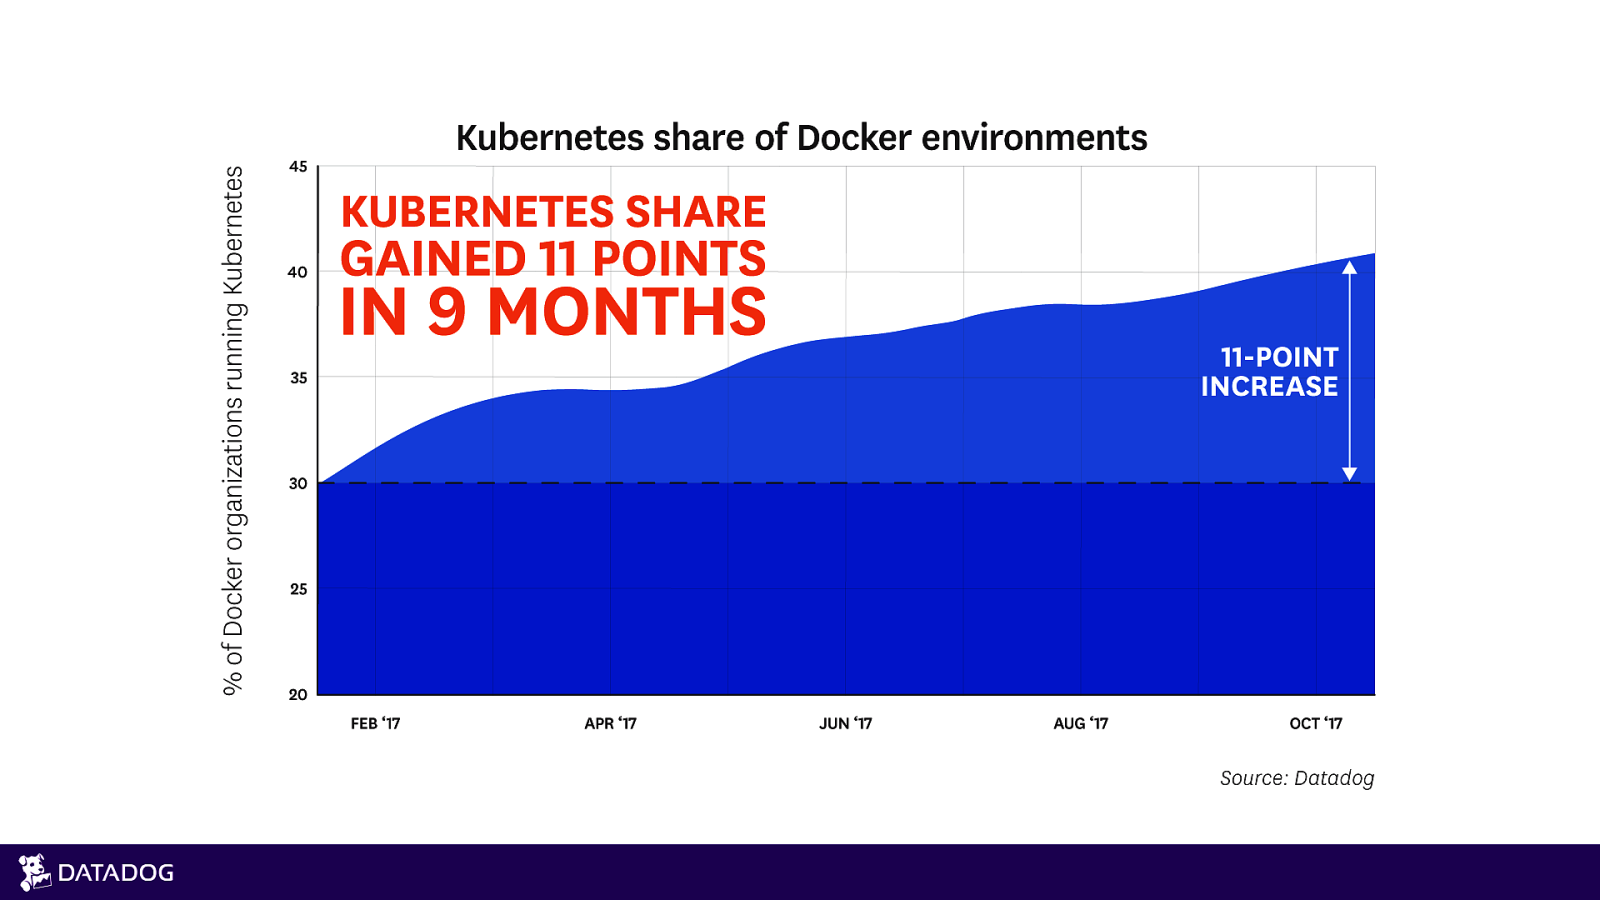
https://www.datadoghq.com/container-orchestration/
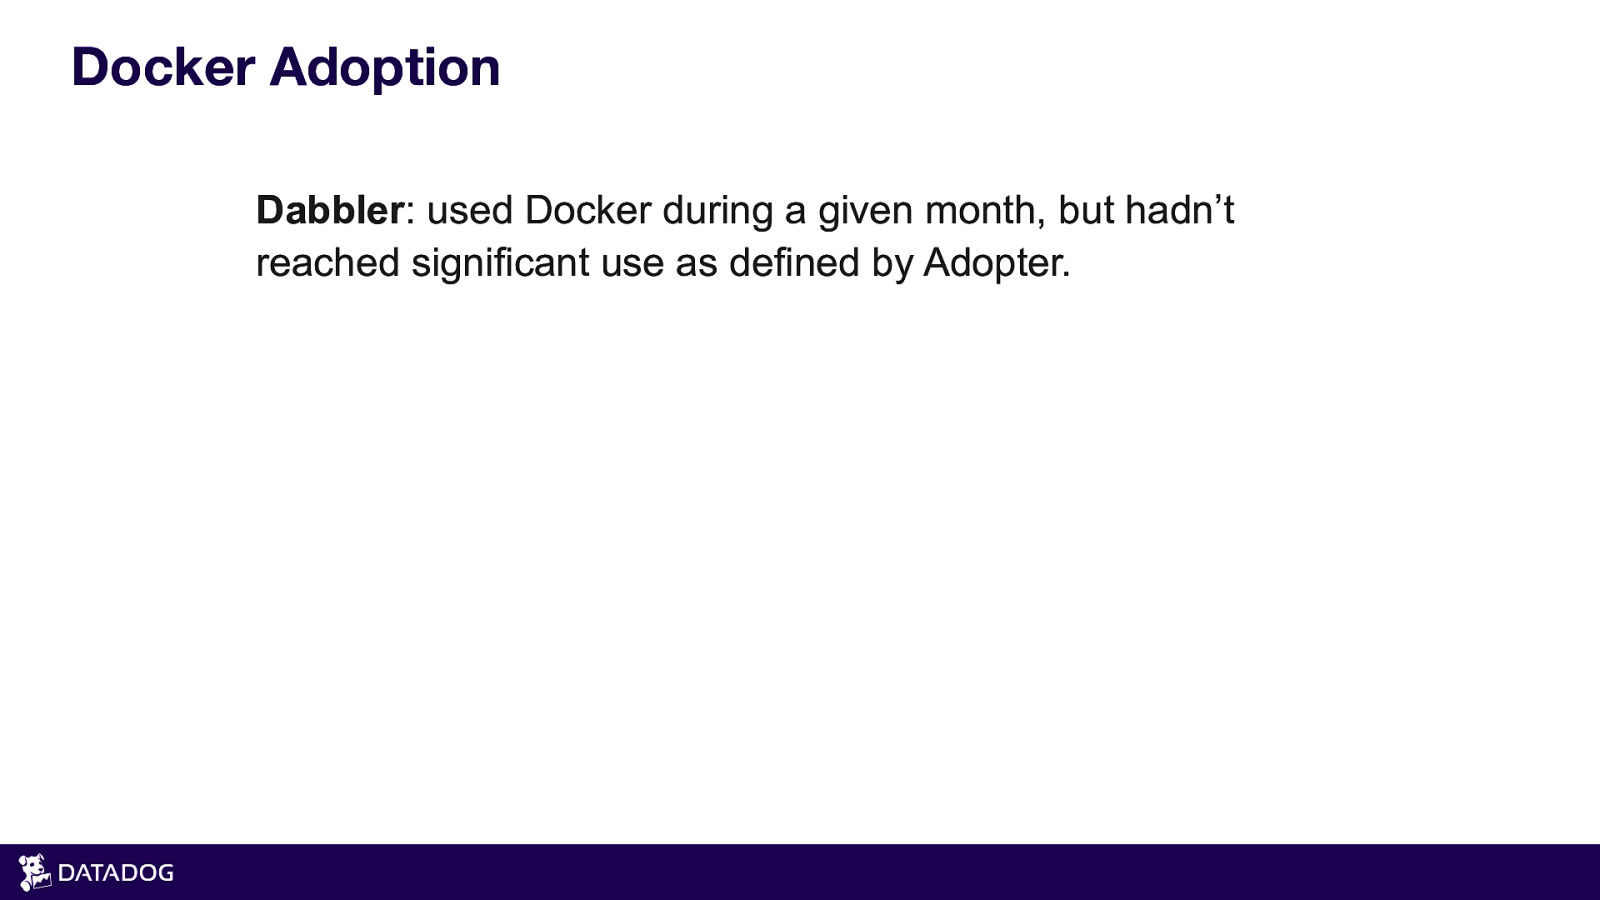
Docker Adoption Dabbler: used Docker during a given month, but hadn’t reached significant use as defined by Adopter.
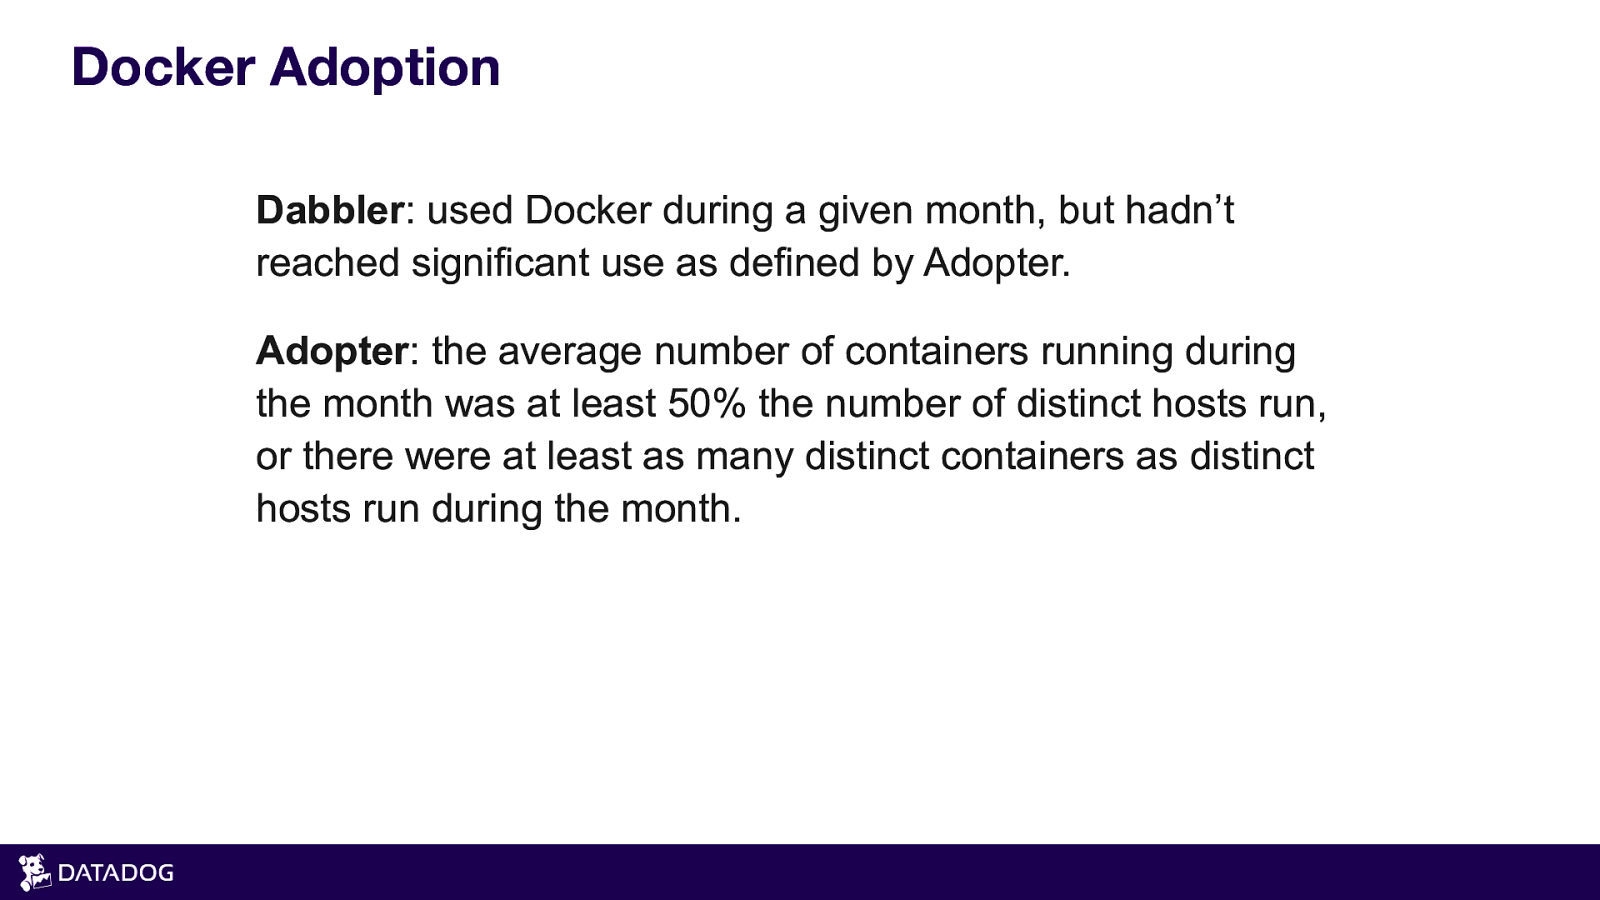
Docker Adoption Dabbler: used Docker during a given month, but hadn’t reached significant use as defined by Adopter. Adopter: the average number of containers running during the month was at least 50% the number of distinct hosts run, or there were at least as many distinct containers as distinct hosts run during the month.
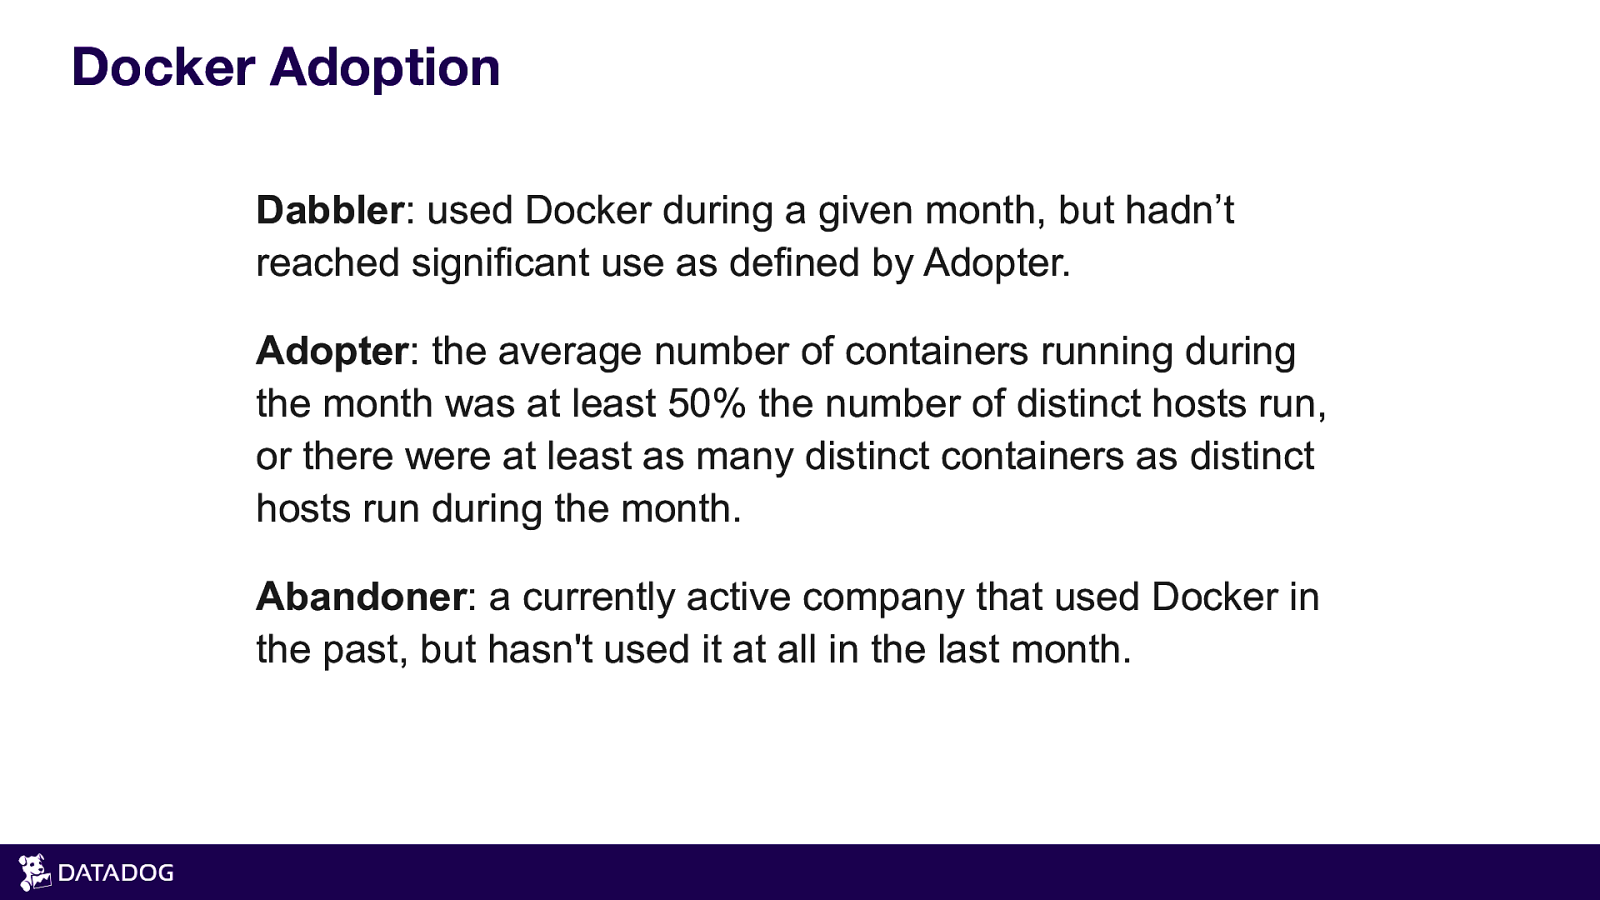
Docker Adoption Dabbler: used Docker during a given month, but hadn’t reached significant use as defined by Adopter. Adopter: the average number of containers running during the month was at least 50% the number of distinct hosts run, or there were at least as many distinct containers as distinct hosts run during the month. Abandoner: a currently active company that used Docker in the past, but hasn’t used it at all in the last month.
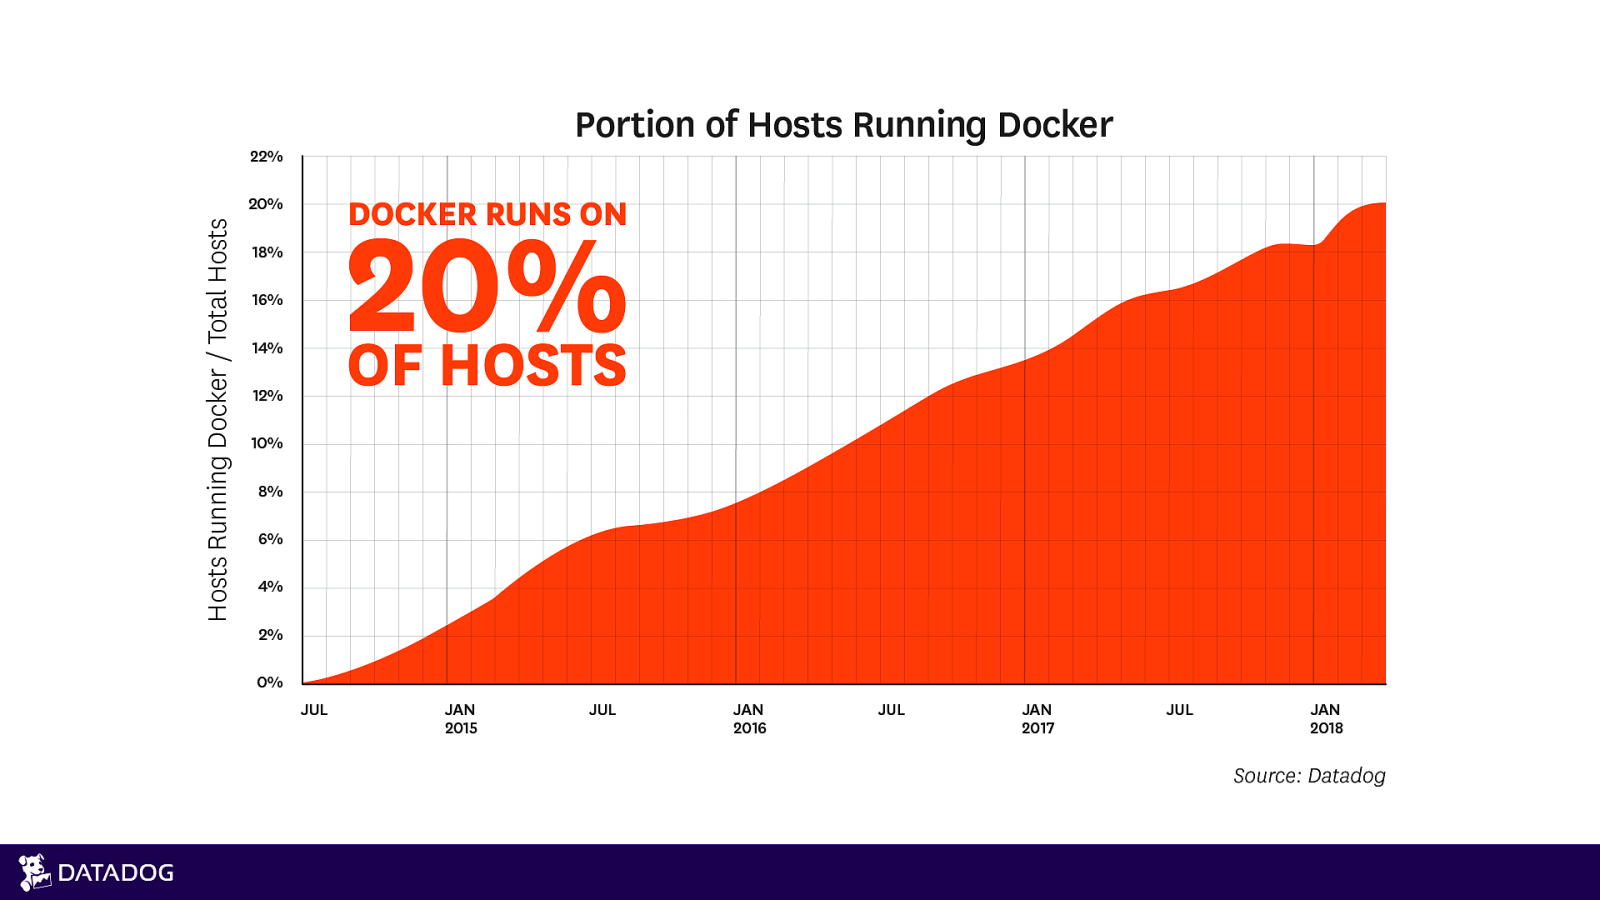

WHAT’S RUNNING?
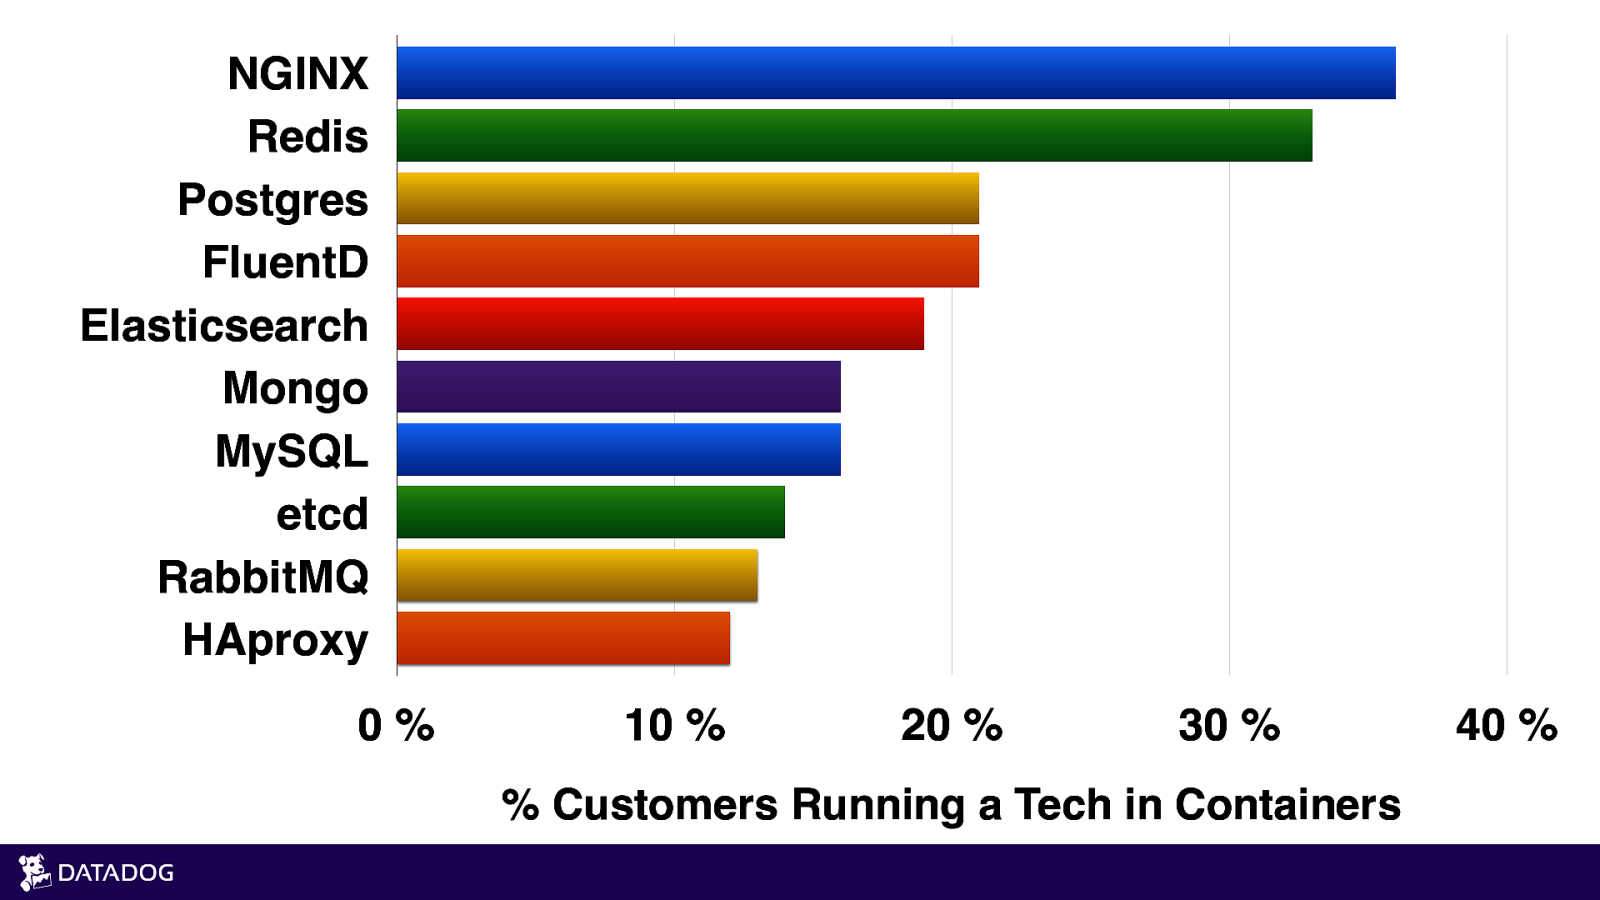
NGINX Redis Postgres FluentD Elasticsearch Mongo MySQL etcd RabbitMQ HAproxy 0% 10 % 20 % 30 % % Customers Running a Tech in Containers 40 %
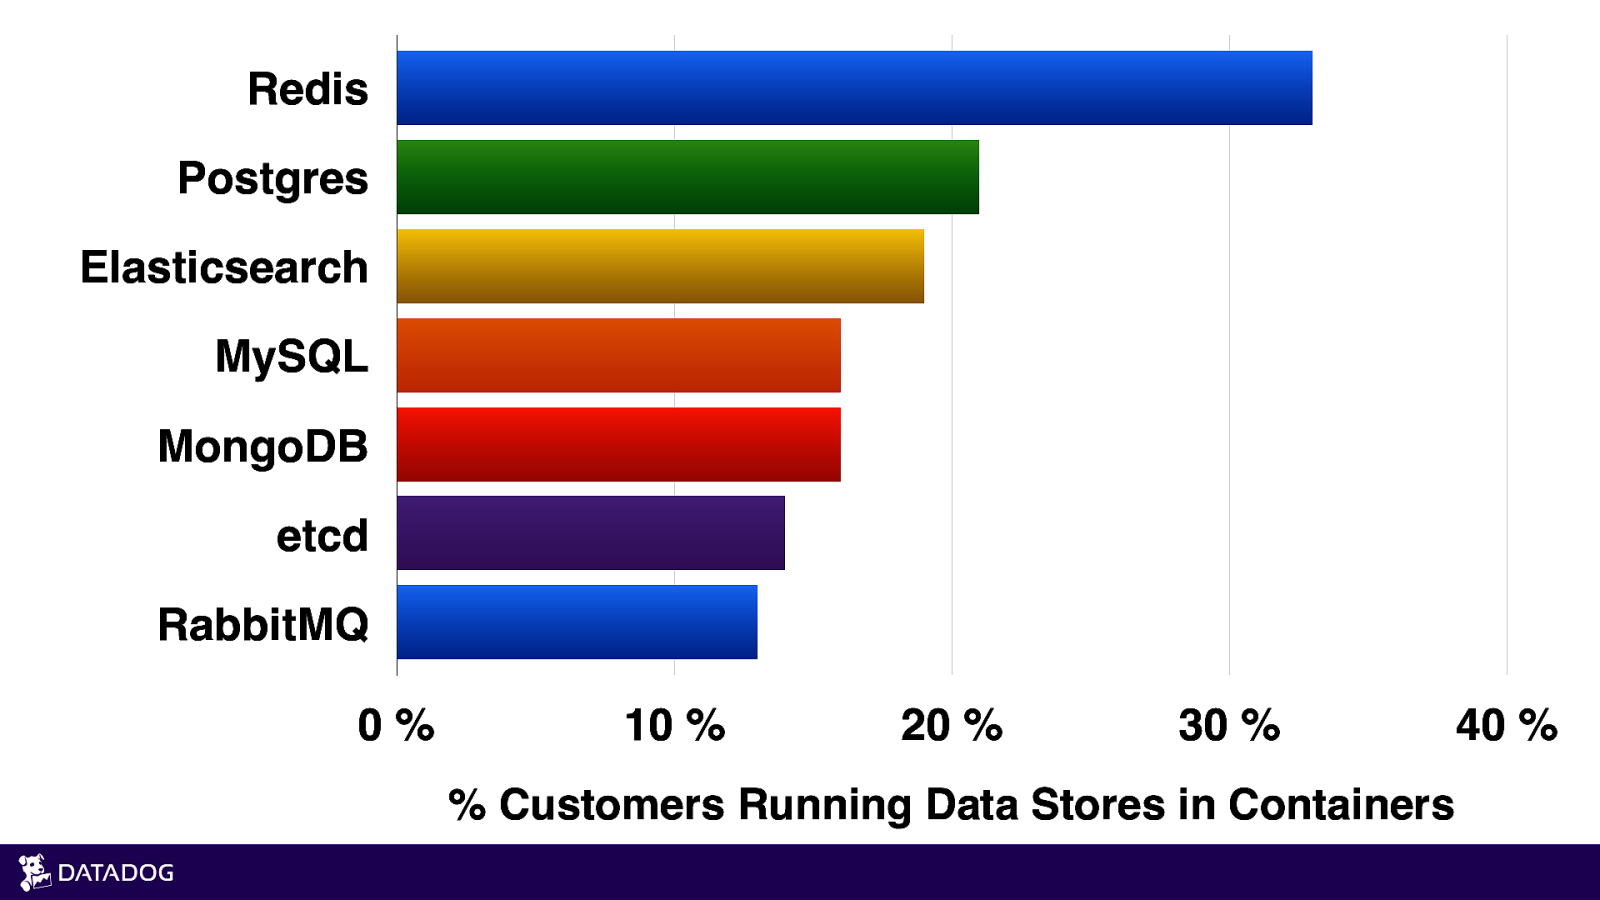
Redis Postgres Elasticsearch MySQL MongoDB etcd RabbitMQ 0% 10 % 20 % 30 % % Customers Running Data Stores in Containers 40 %
ENTER: ORCHESTRATION
NEW CONTAINER: WHO DIS?
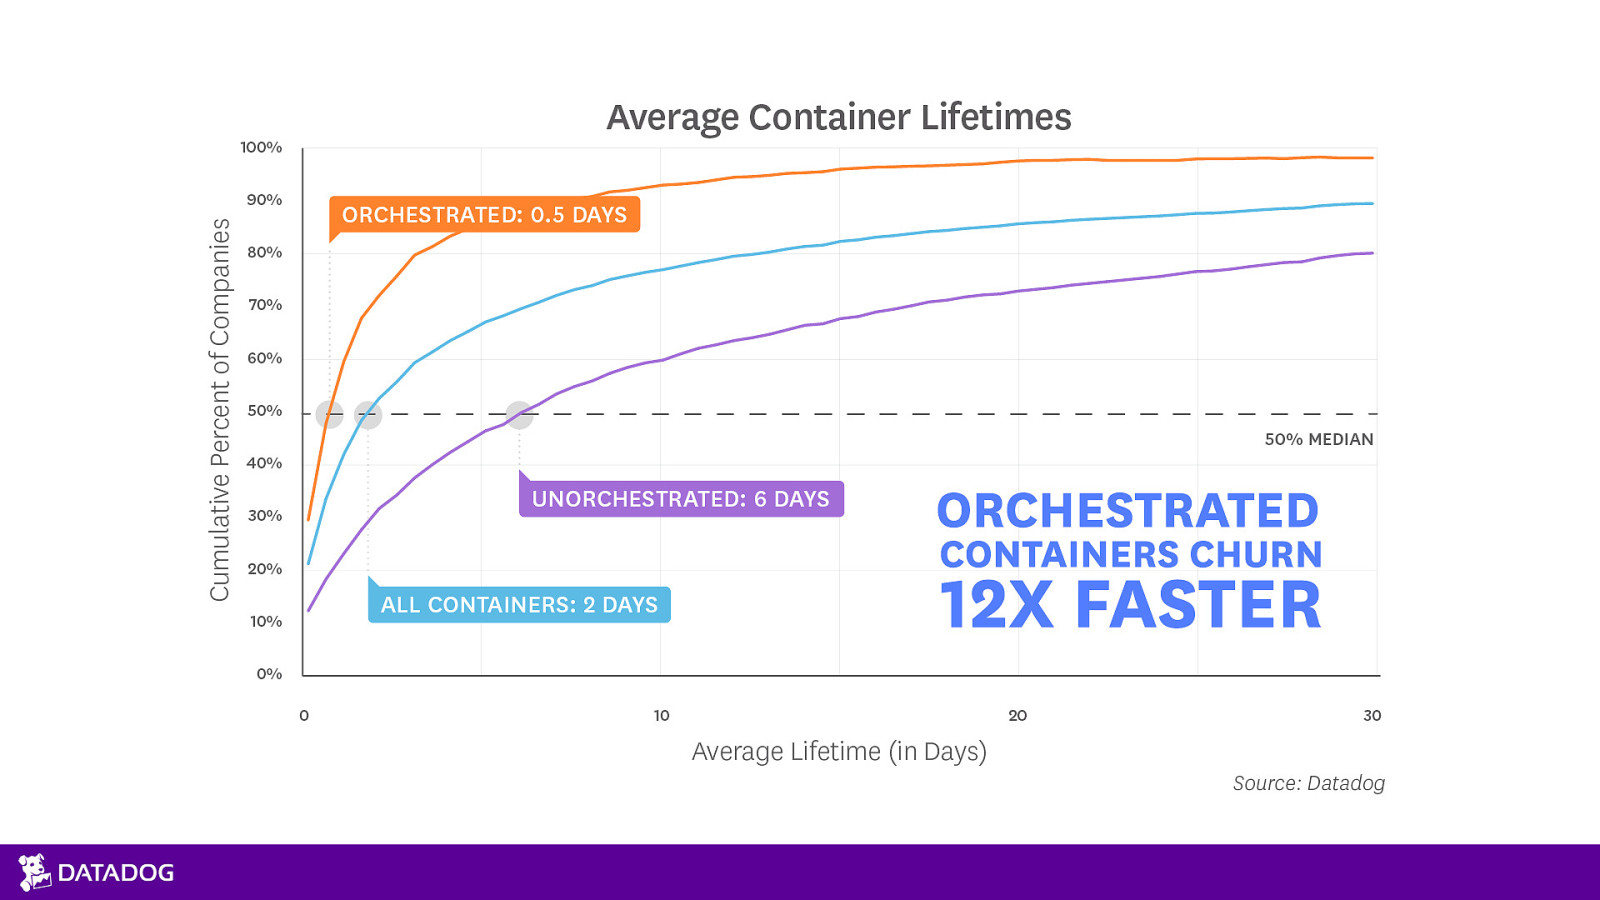
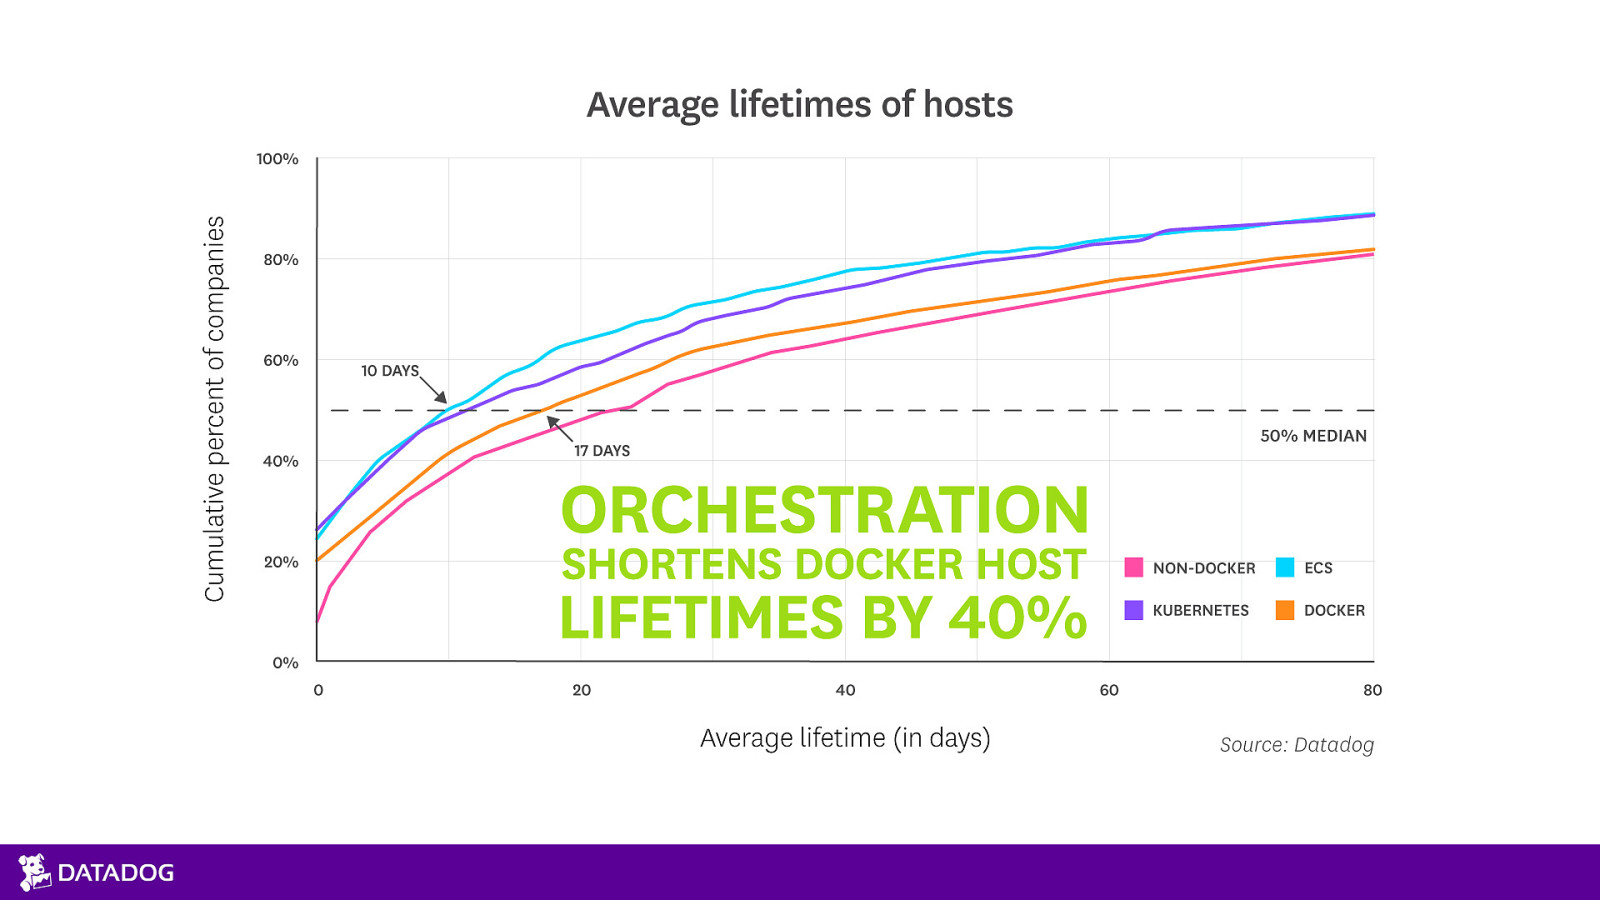

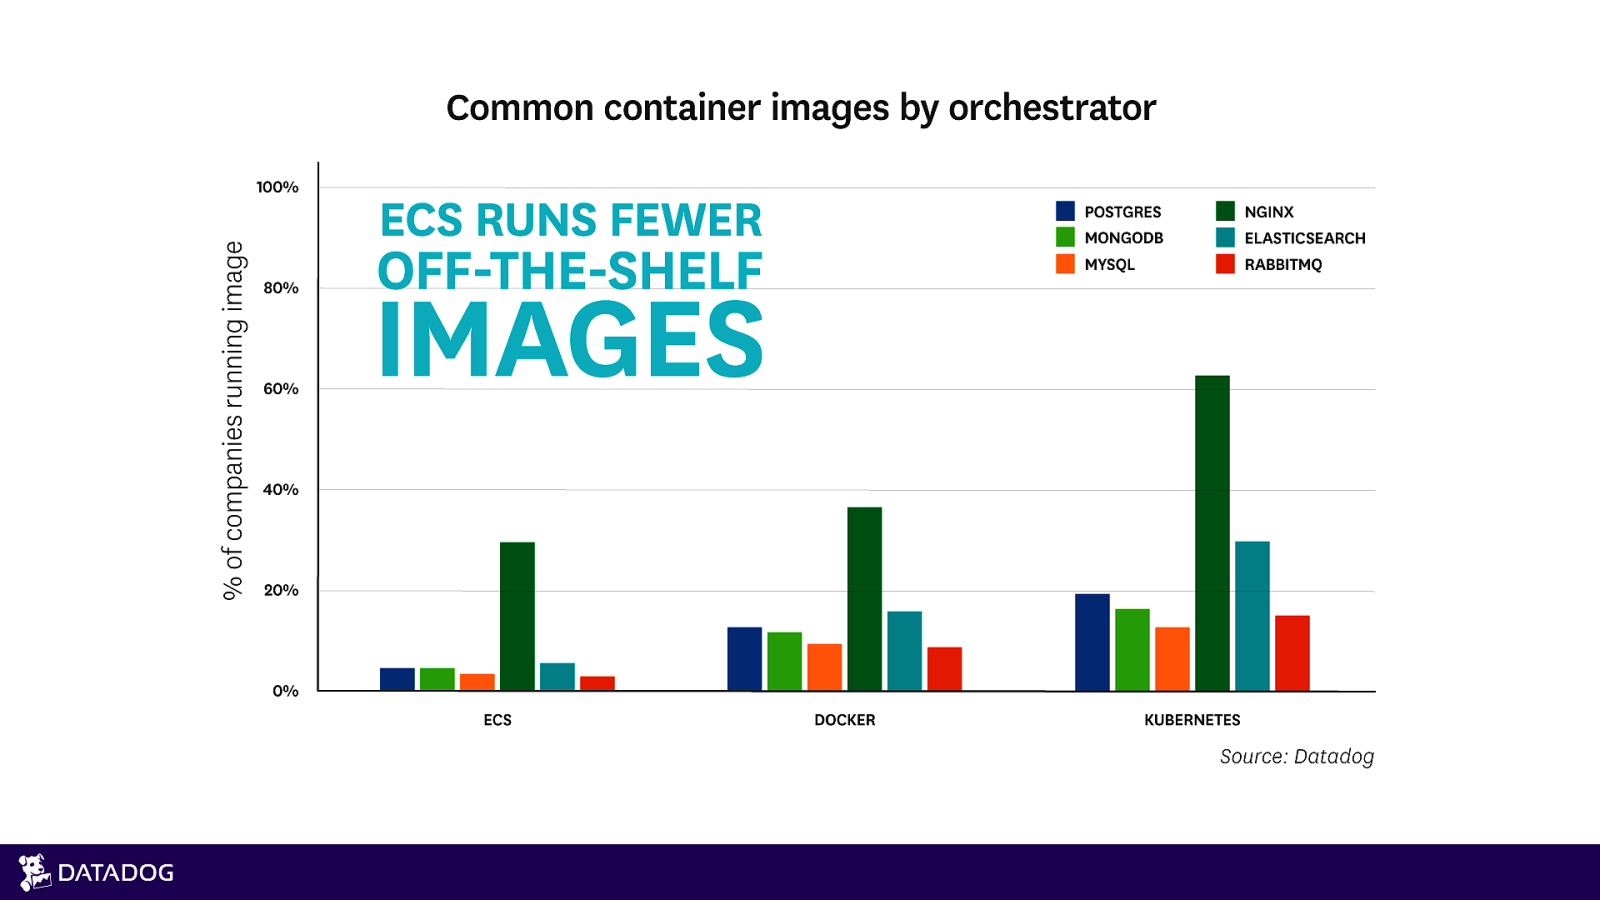
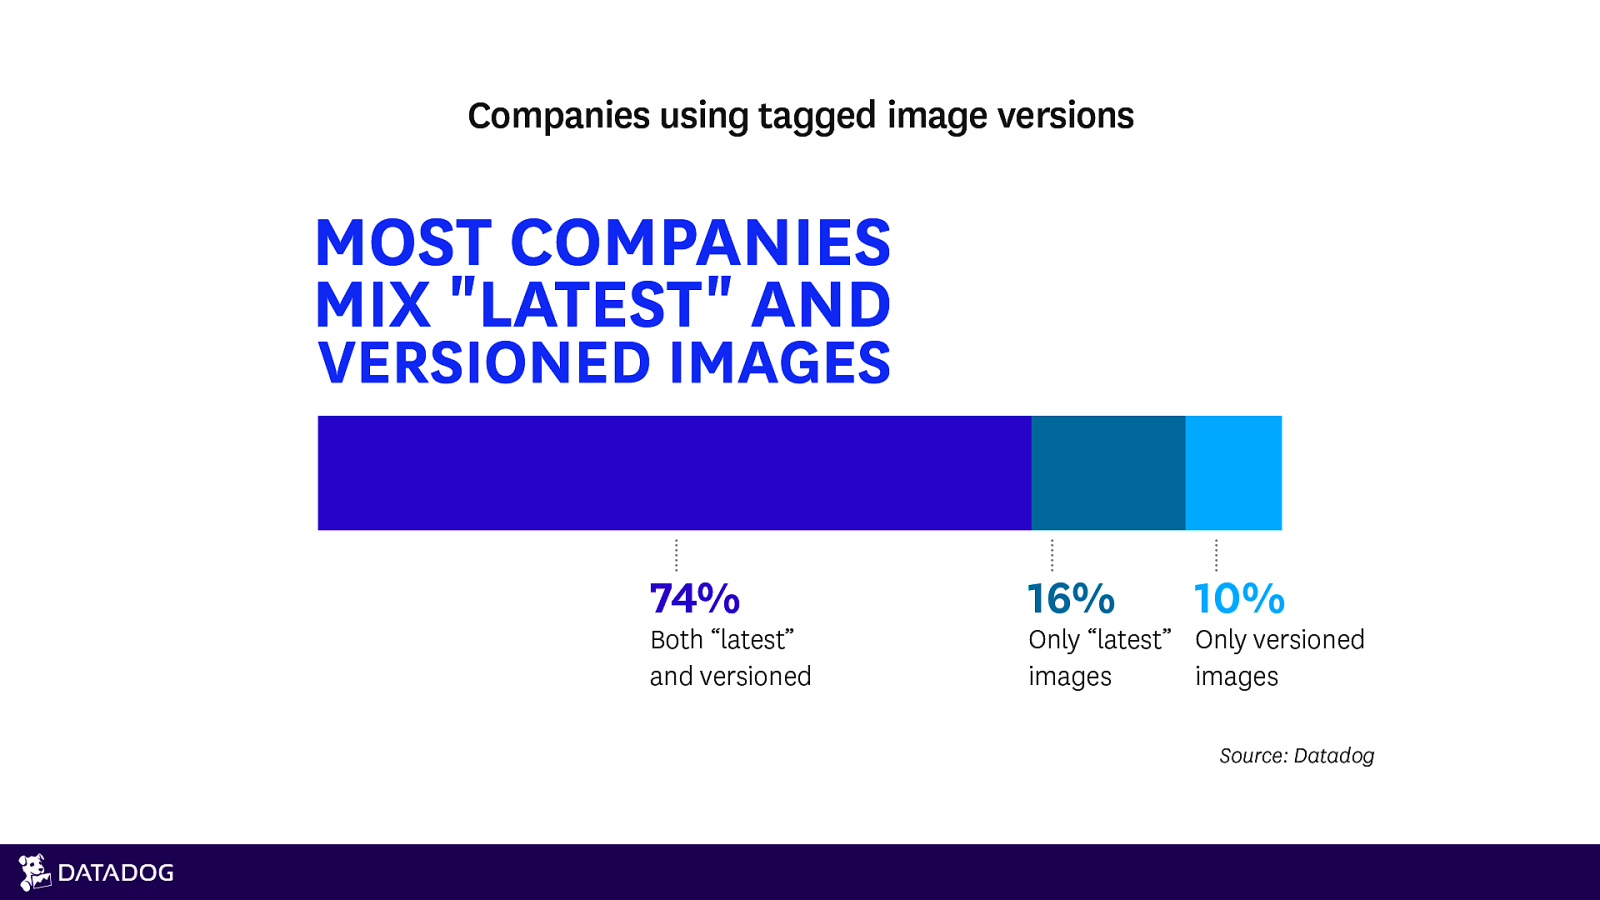
WHAT’S RUNNING? PART 2: THE RUNNINATING

4 QUALITIES OF GOOD METRICS NOT ALL METRICS ARE EQUAL
MUST BE WELL UNDERSTOOD
SUFFICIENT GRANULARITY
TAGGED & FILTERABLE

LONG-LIVED
CUSTOM METRICS & K8S
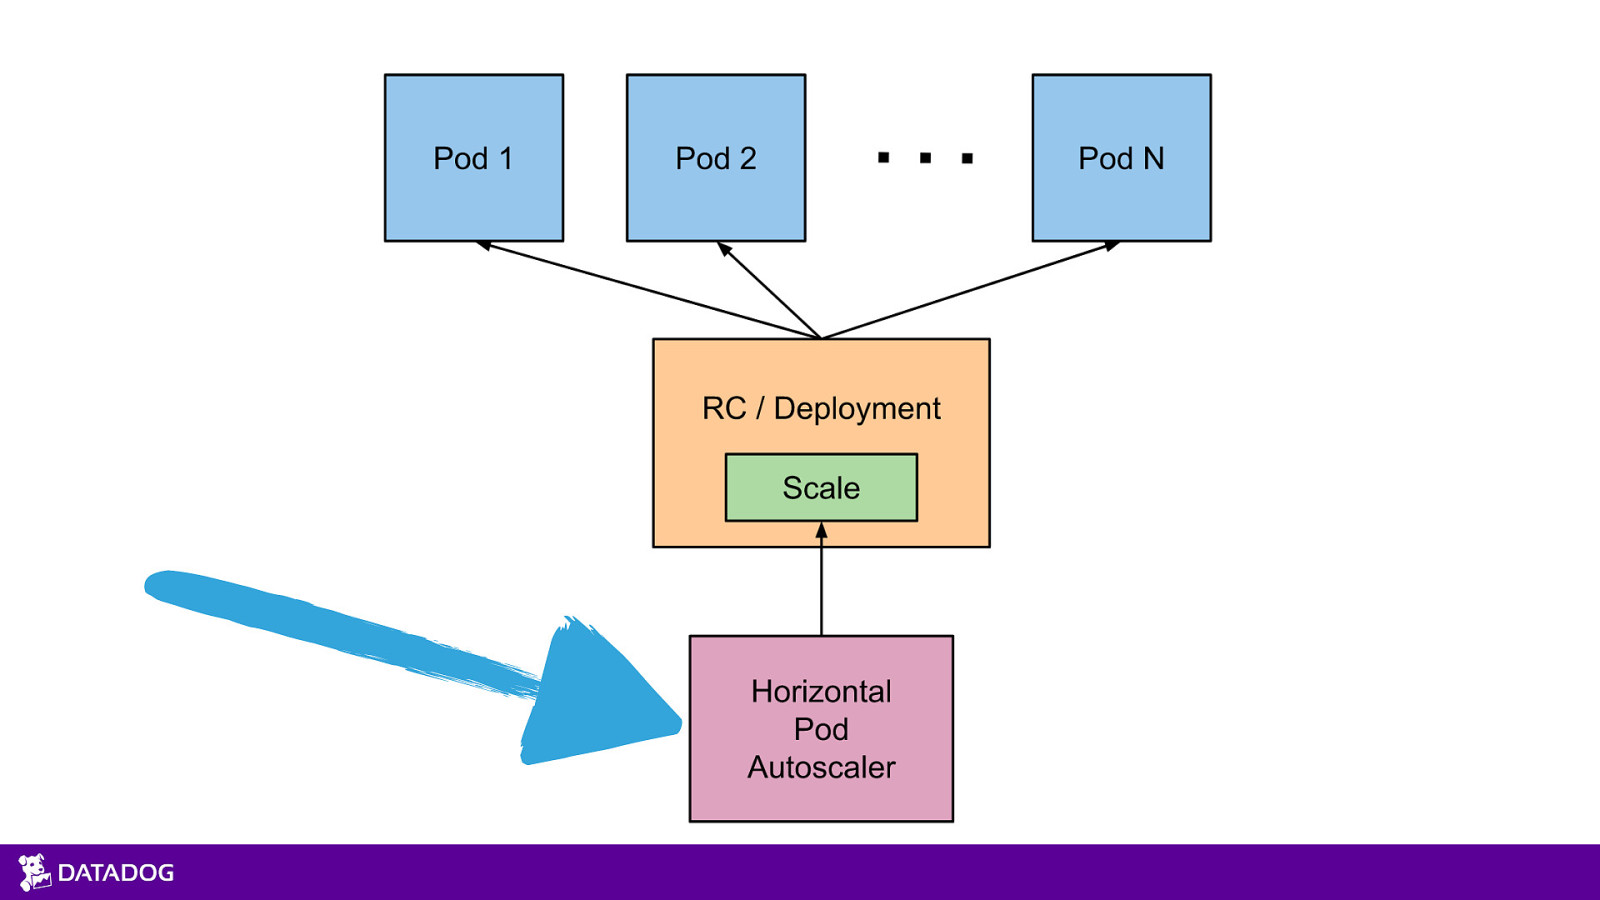
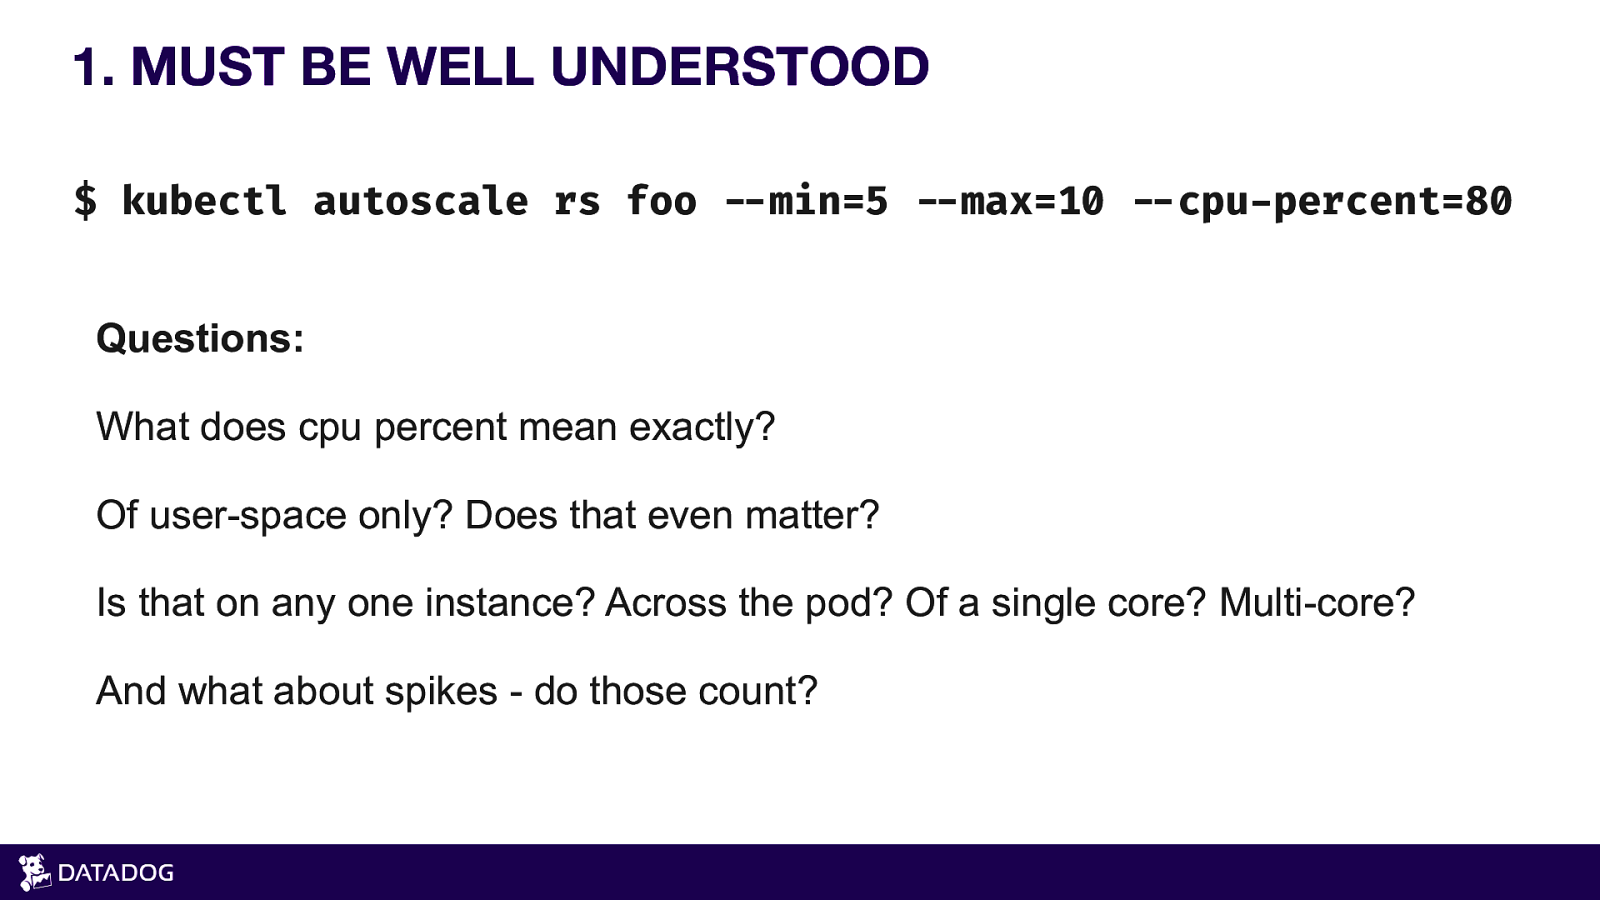
MUST BE WELL UNDERSTOOD $ kubectl autoscale rs foo !—min=5 !—max=10 !—cpu-percent=80 Questions: What does cpu percent mean exactly? Of user-space only? Does that even matter? Is that on any one instance? Across the pod? Of a single core? Multi-core? And what about spikes - do those count?
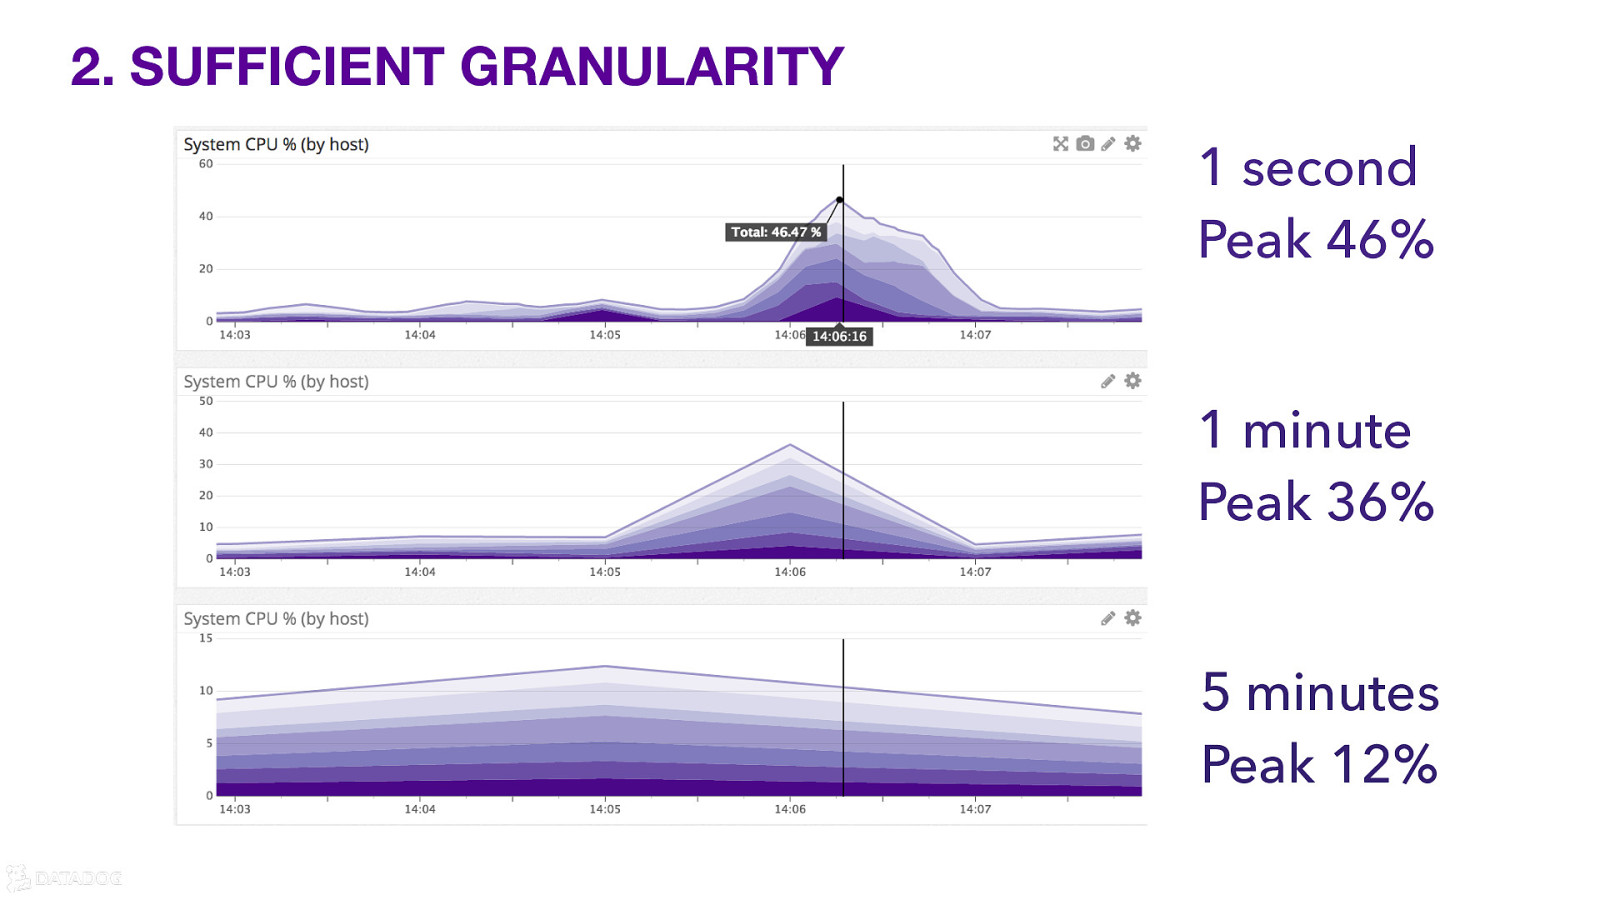
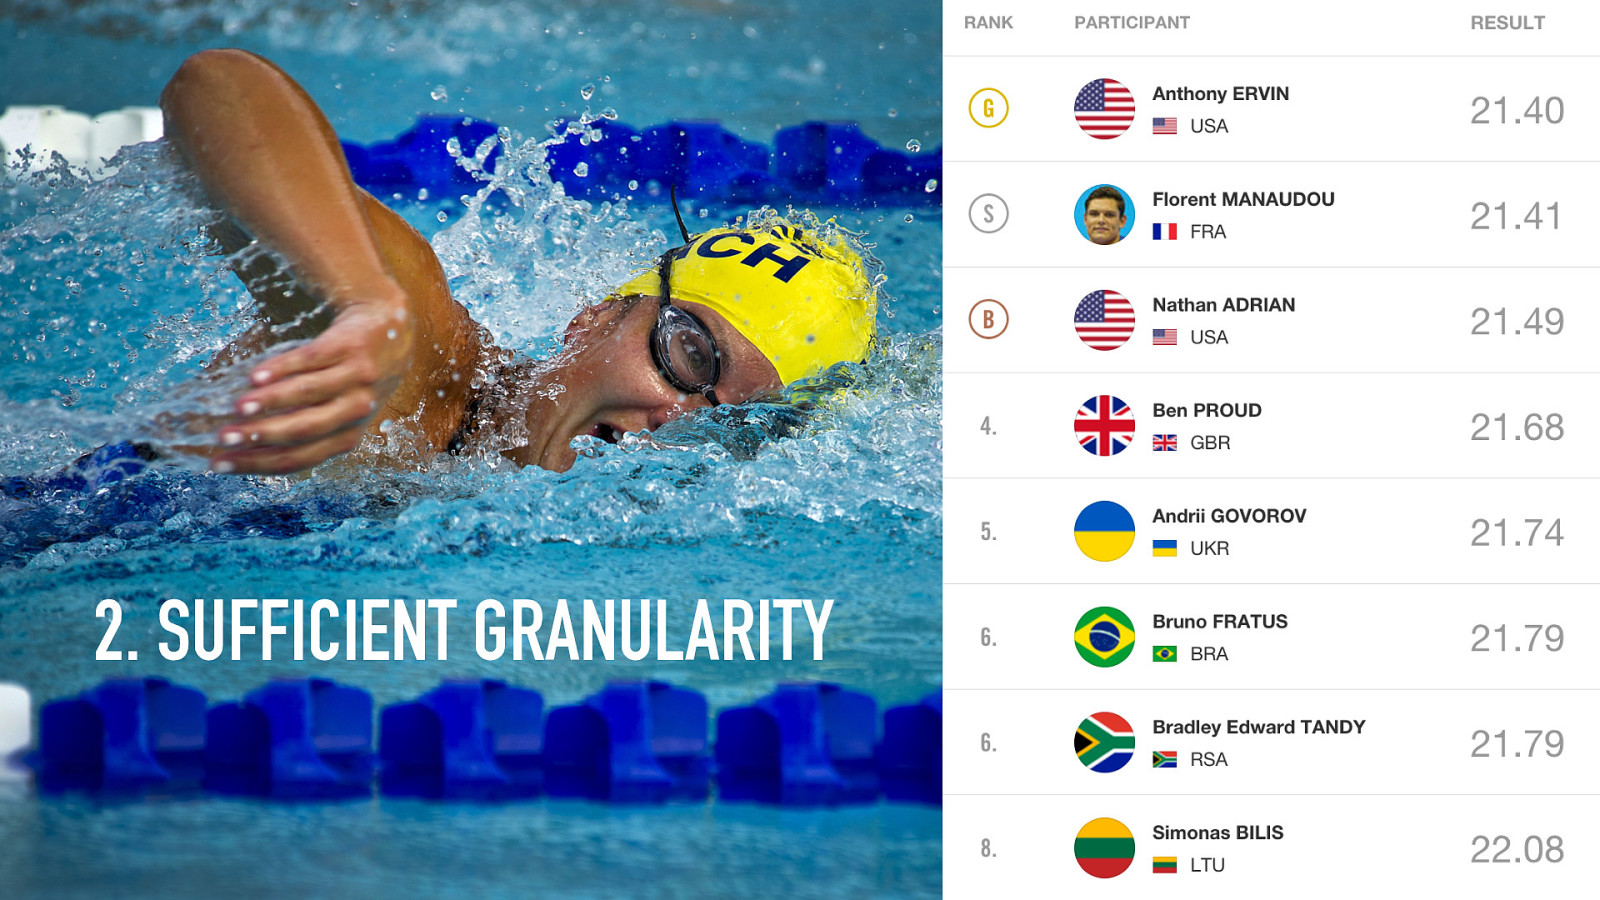
SUFFICIENT GRANULARITY 1 second Peak 46% 1 minute Peak 36% 5 minutes Peak 12%
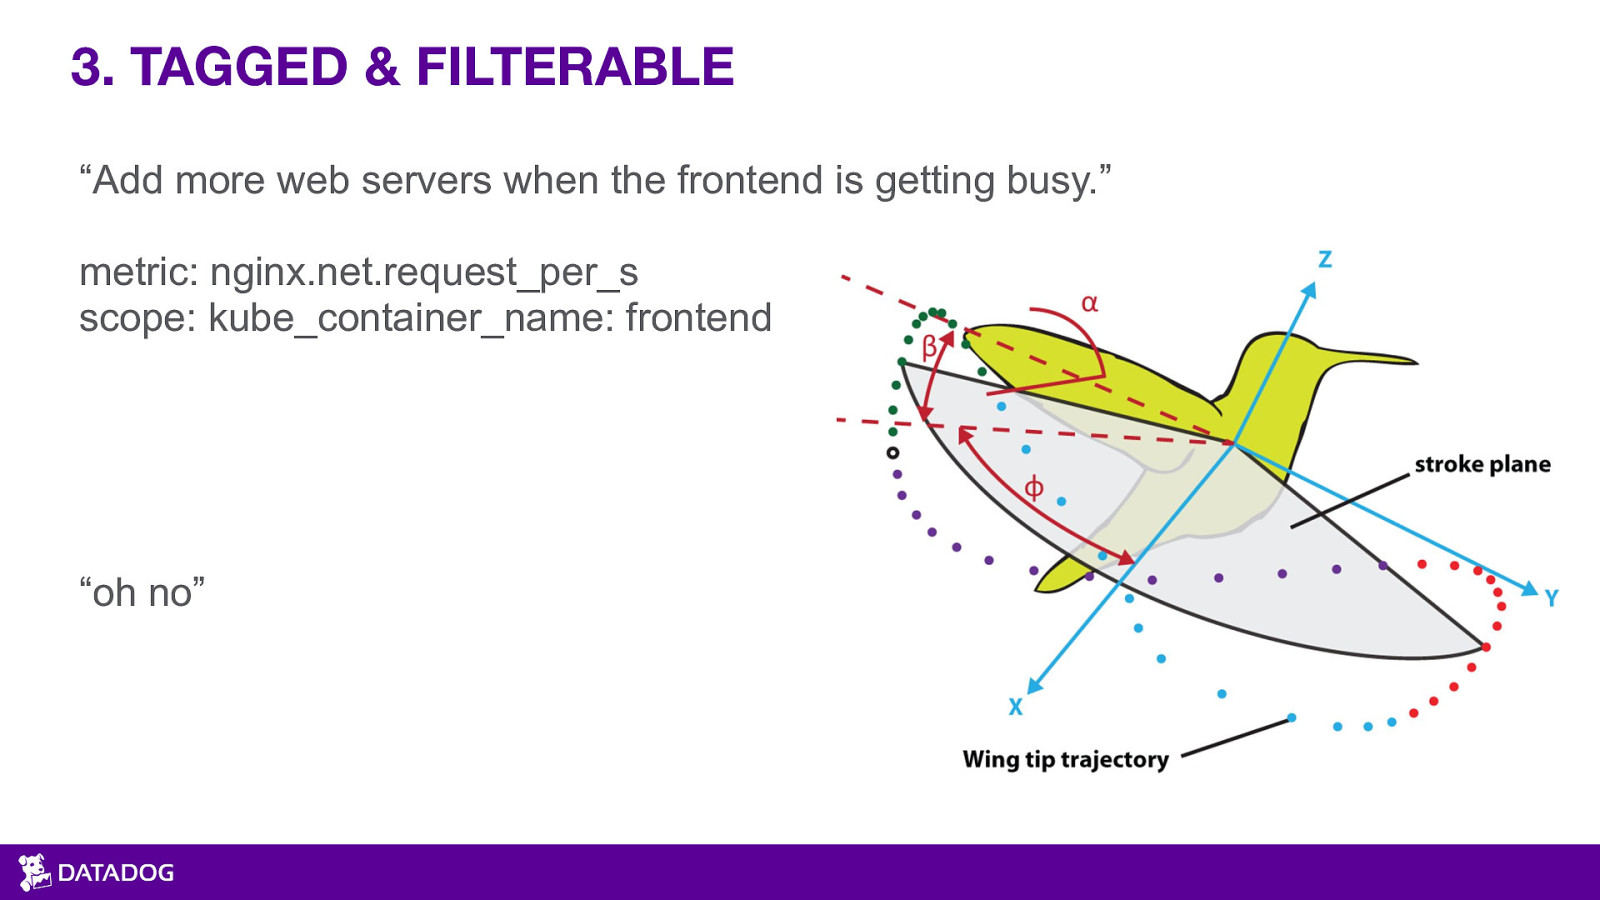
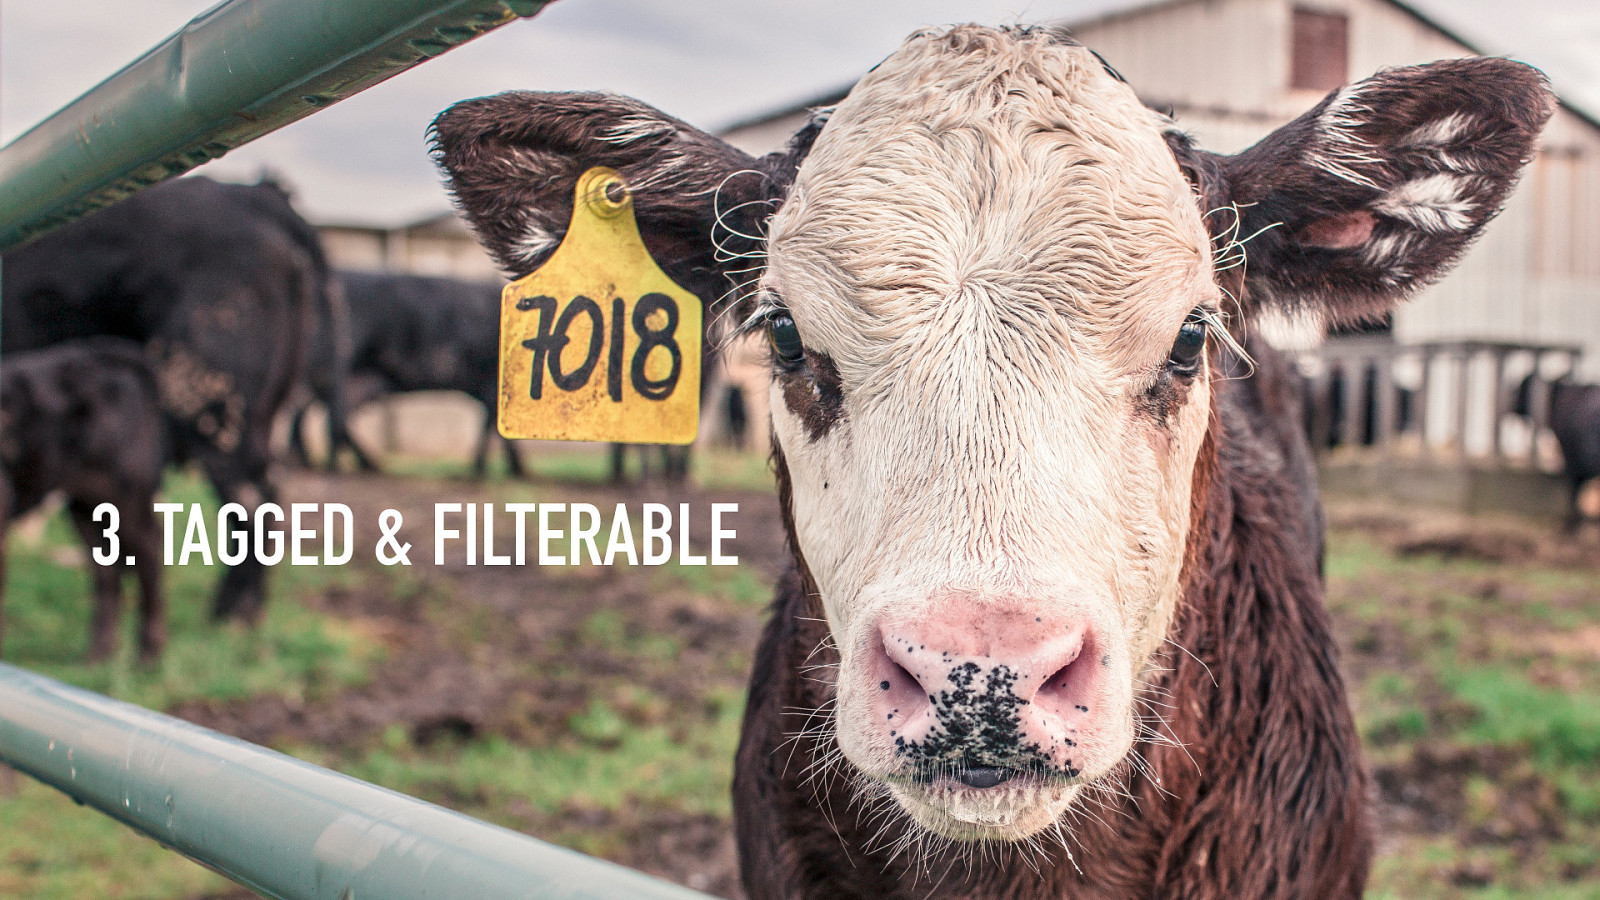
TAGGED & FILTERABLE “Add more web servers when the frontend is getting busy.” metric: nginx.net.request_per_s scope: kube_container_name: frontend “oh no”
LONG-LIVED “There always seems to be ten web servers running. Should we increase the maximum number in the set?” Questions: What does normal even look like? Is normal stable over time? What about week-ends? Did you just notice now? Seriously, how long has it been this way?
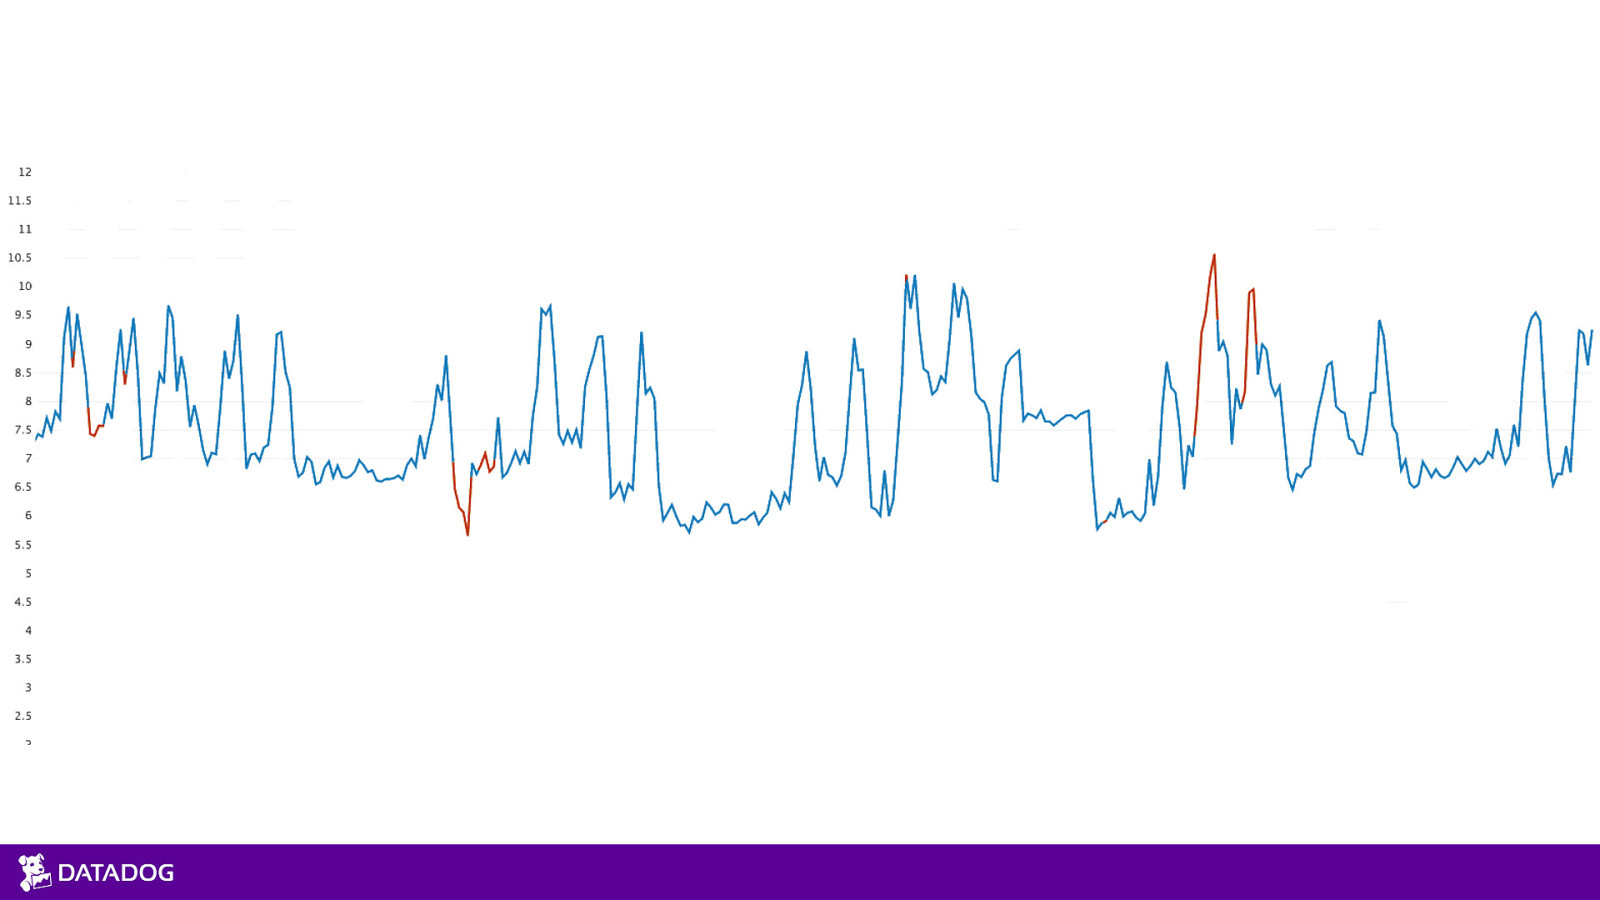
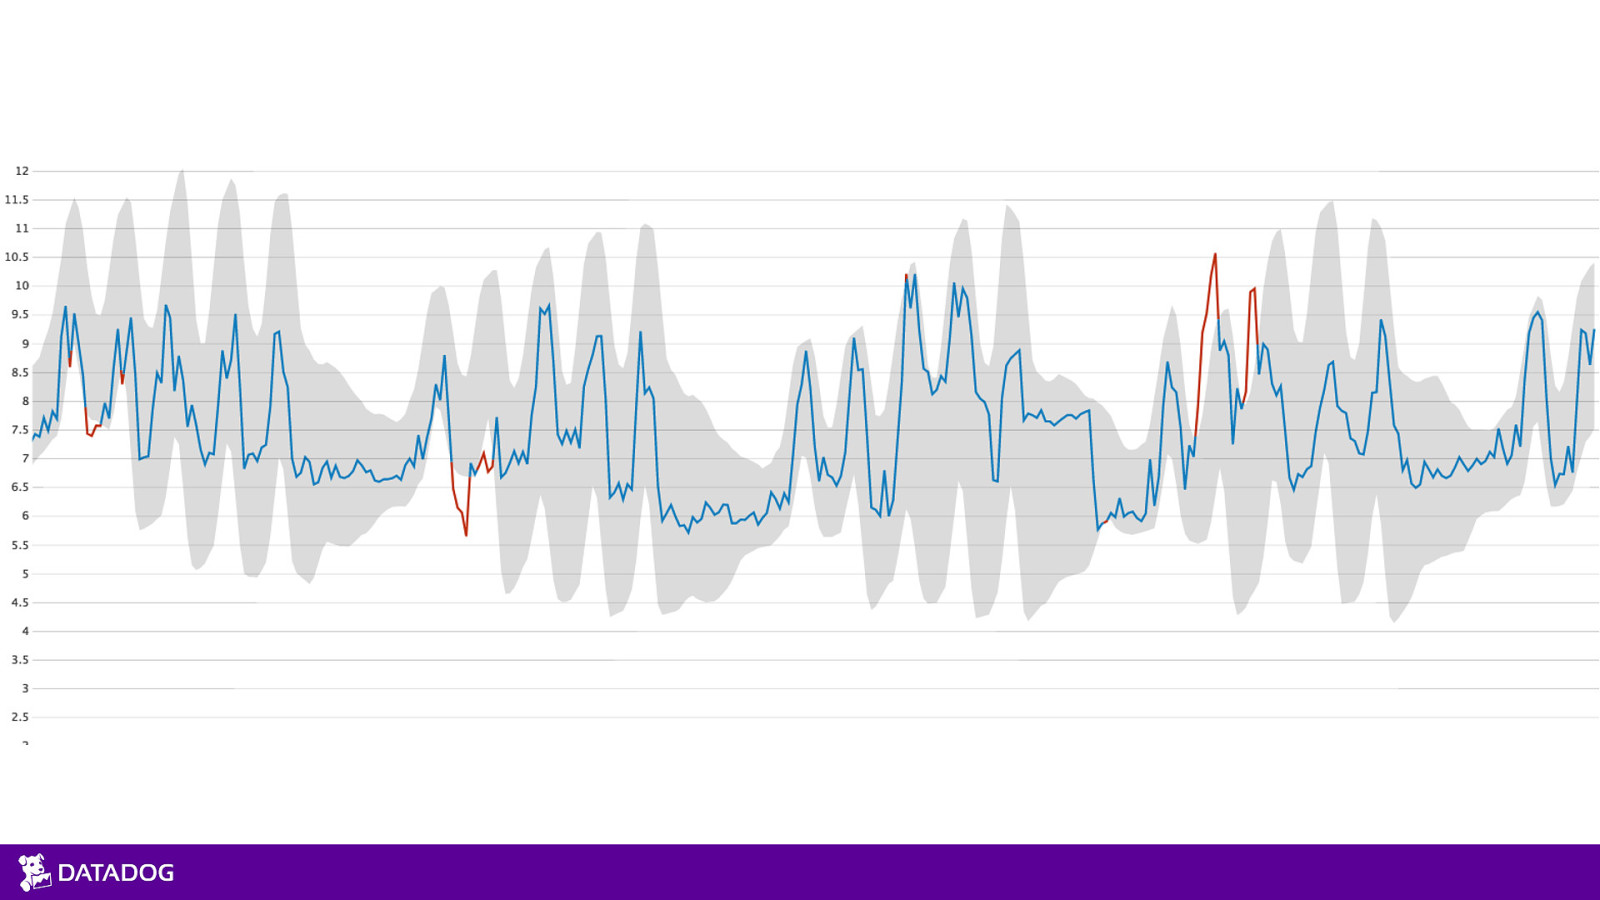
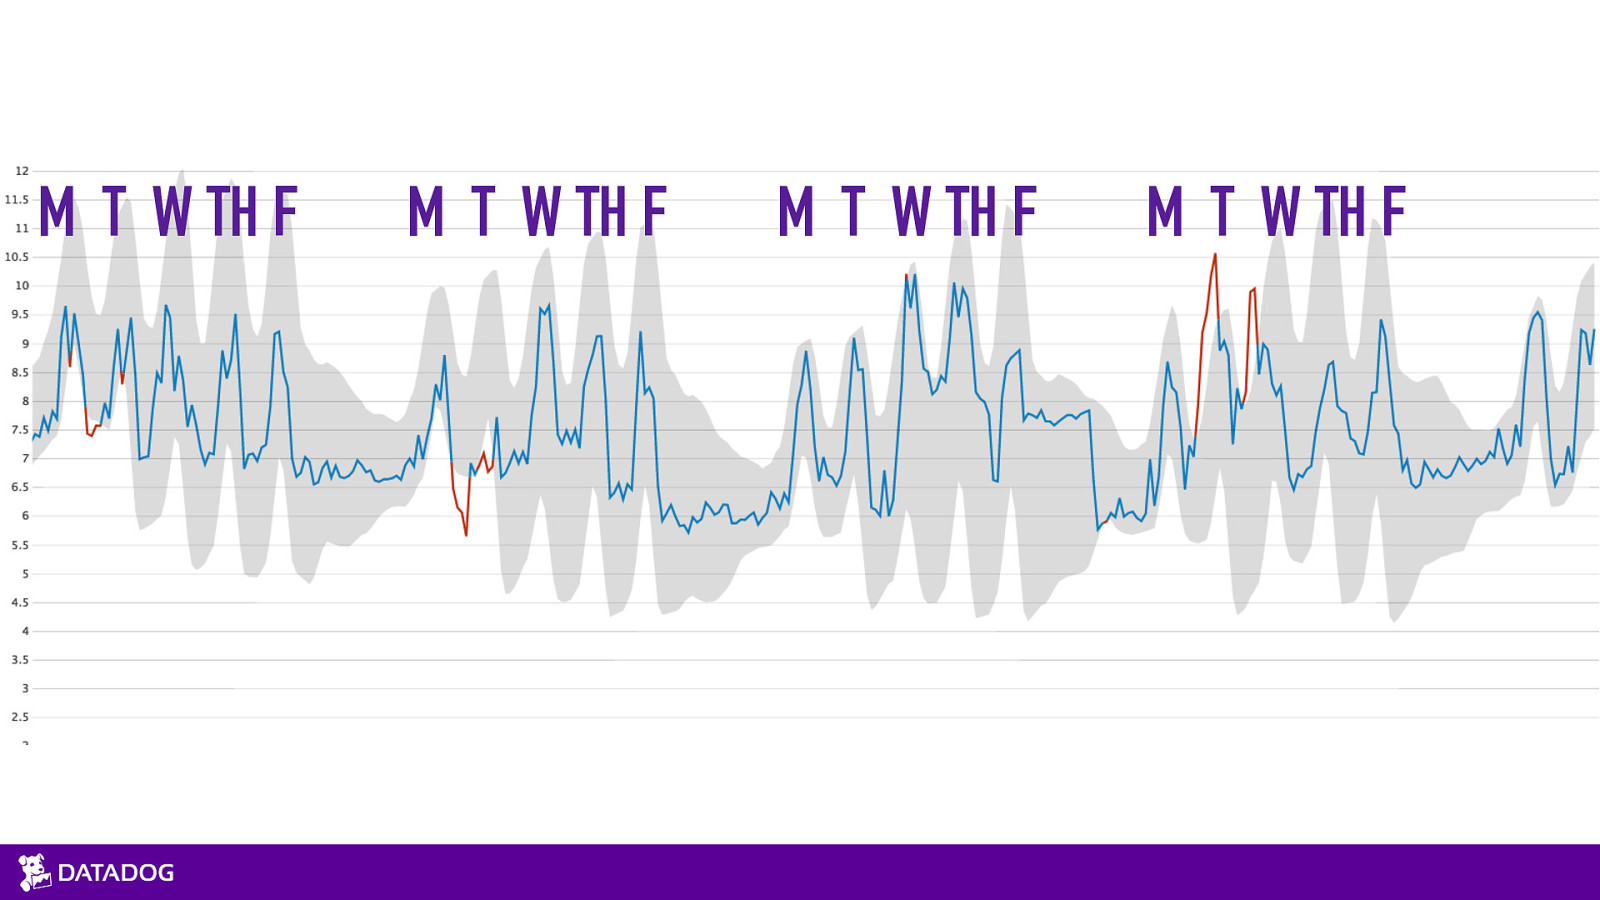
M T W TH F M T W TH F M T W TH F M T W TH F
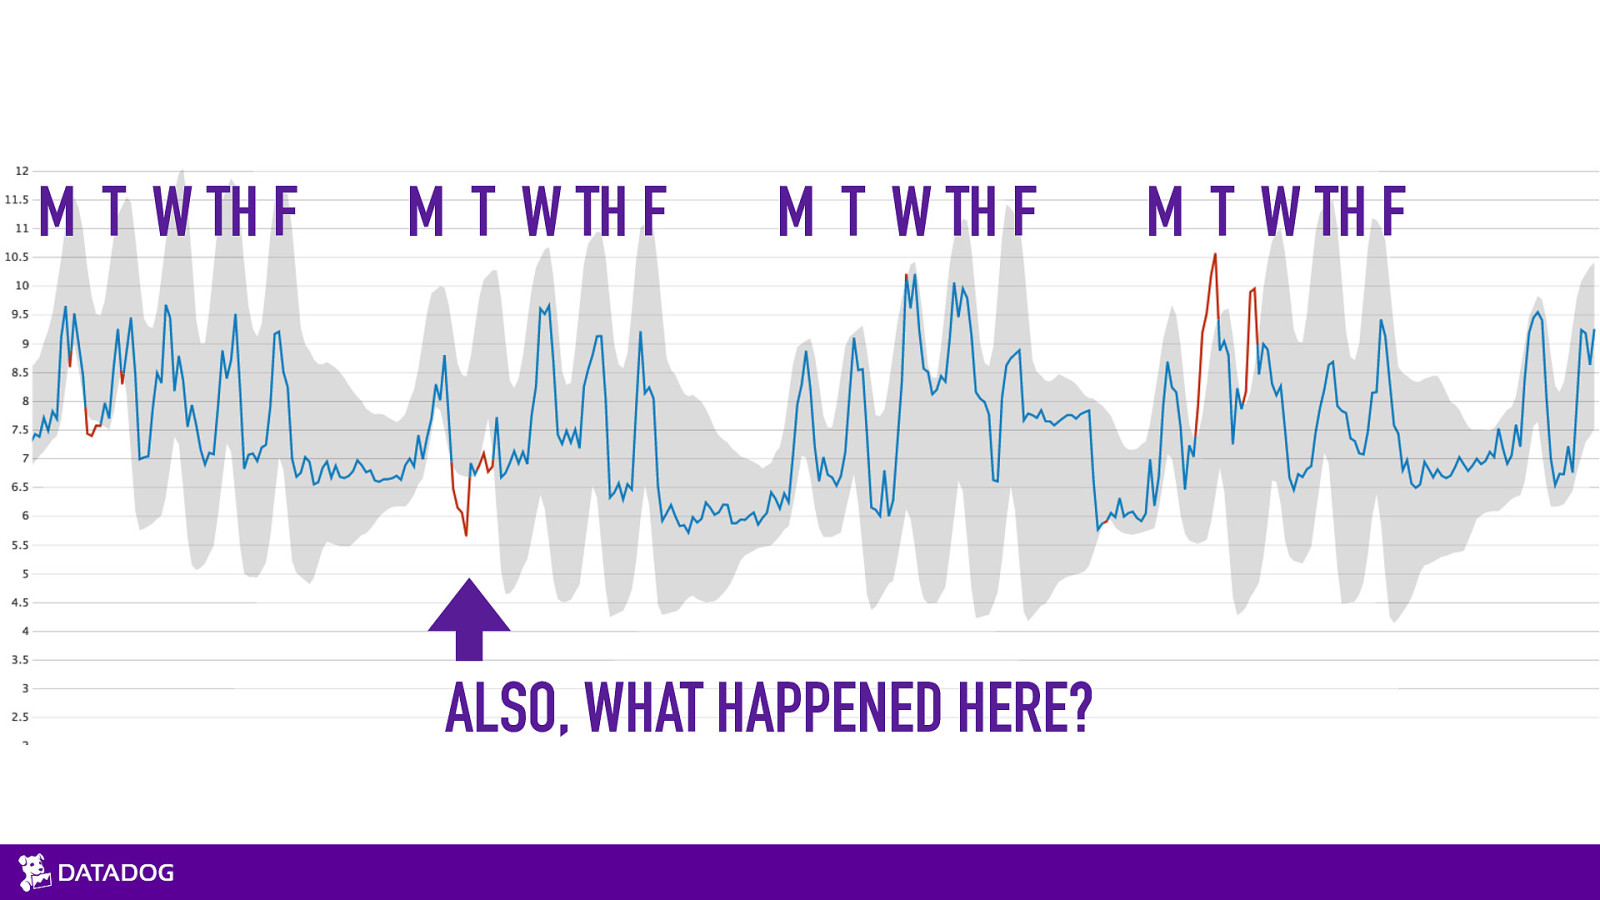
M T W TH F M T W TH F M T W TH F ALSO, WHAT HAPPENED HERE? M T W TH F
TRENDS IN CONTAINERISATION 2. THE QUALITIES OF GOOD METRICS 3. SCALING KUBERNETES (W/ METRICS)

MERCI ! DANIEL MAHER @phrawzty [email protected]
Resources
- Event Listing
SkillsMatter went into administration in 2019. Wayback Machine to the rescue!
Buzz and feedback
Thanks for your talk @phrawzty , super interesting stats, especially the length of container life stuff. #cloudnativelondon — Chris Priest (@cjrpriest) September 26, 2018
@cjrpriest
"Most of the @kubernetesio usage we are seeing at @datadoghq is in dev and test workloads. We're sure this will change as the tech matures... Unless you follow along with @samnewman 's thinking about serverless from this morning" :-) @phrawzty #CloudNativeLondon pic.twitter.com/jMHiyJYhh4 — Daniel Bryant (@danielbryantuk) September 26, 2018
@danielbryantuk